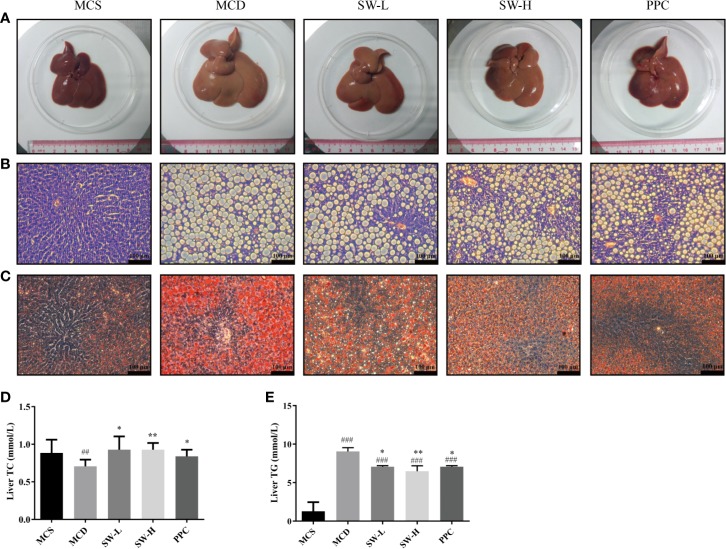
Figure 4.
Effect of Si-Wei-Qing-Gan-Tang (SWQGT) and PPC on histopathological examination and liver total cholesterol (TC), TG levels of rats in each group. (A) liver morphology, (B) HE stained sections (× 200), (C) Oil Red O stained sections (× 200), (D) liver TC levels, (E) liver triglyceride (TG) levels. methionine and choline-sufficient (MCS) group: MCS diet-fed rats, methionine and choline deficient (MCD) group: MCD diet-fed rats, SW-L group: rats fed with low dose of SWQGT and MCD diet, SW-H group: rats fed with high dose of SWQGT and MCD diet, PPC group: rats fed with PPC and MCD diet. The data are presented as median and interquartile range, ## p < 0.01, ### p < 0.001 vs. MCS group; * p < 0.05, ** p < 0.01 vs. MCD group.

