
Fig. 3.
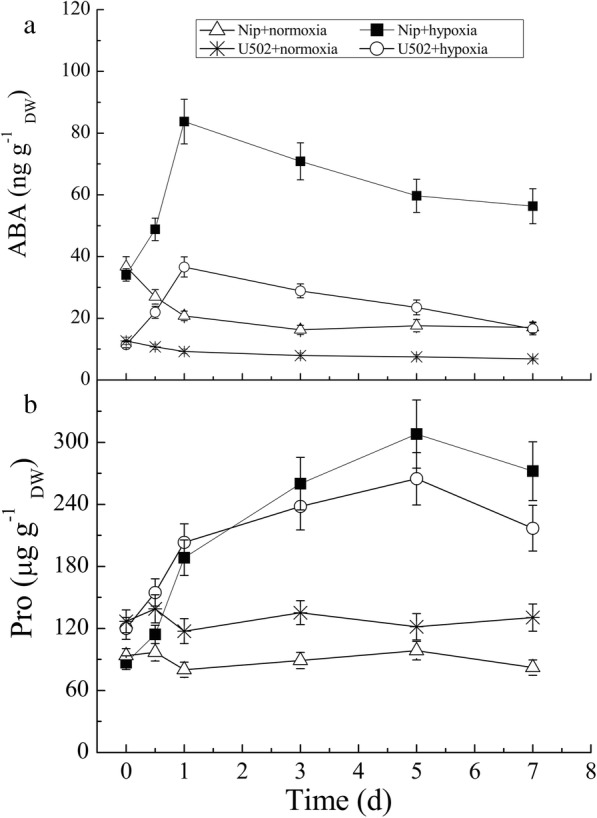
Time course of changes in ABA (a) and proline (b) contents in the roots of both cultivars subjected to normoxic and hypoxic conditions. DW represents dry weight. Data are the mean ± SE of three independent experiments
Official websites use .gov
A
.gov website belongs to an official
government organization in the United States.
Secure .gov websites use HTTPS
A lock (
) or https:// means you've safely
connected to the .gov website. Share sensitive
information only on official, secure websites.
Time course of changes in ABA (a) and proline (b) contents in the roots of both cultivars subjected to normoxic and hypoxic conditions. DW represents dry weight. Data are the mean ± SE of three independent experiments