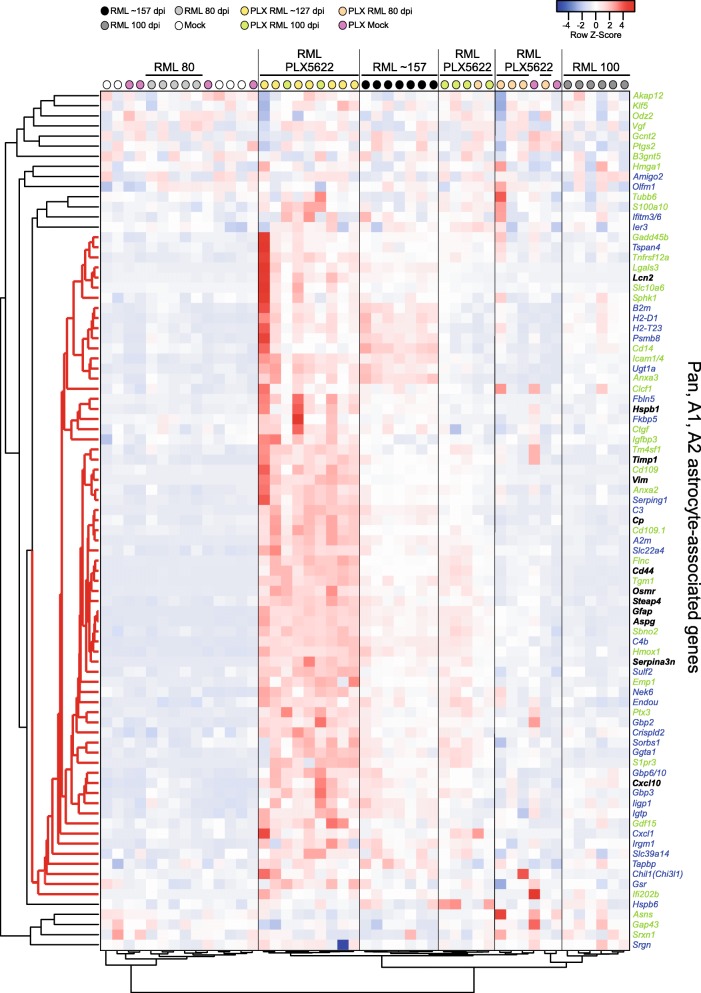
Fig. 9.
Pearson correlation heatmap and average linkage hierarchical cluster analysis of the row Z-scores obtained from our RNA-seq dataset from reactive astrocyte genes. The gene designations are to the right of the heatmap. Genes in black are associated with Pan-reactive astrocytes. Genes in blue are associated with A1-reactive astrocytes. Genes in green are associated with A2-reactive astrocytes. The mouse groups are color coded (refer to key on the figure) and several are labeled for ease of comparison. A core cluster of 66 genes representing a unique mix of Pan-, A1-, and A2-associated genes that display a coordinated pattern of expression during prion disease are indicated with red distance lines to the left of the dendrogram

