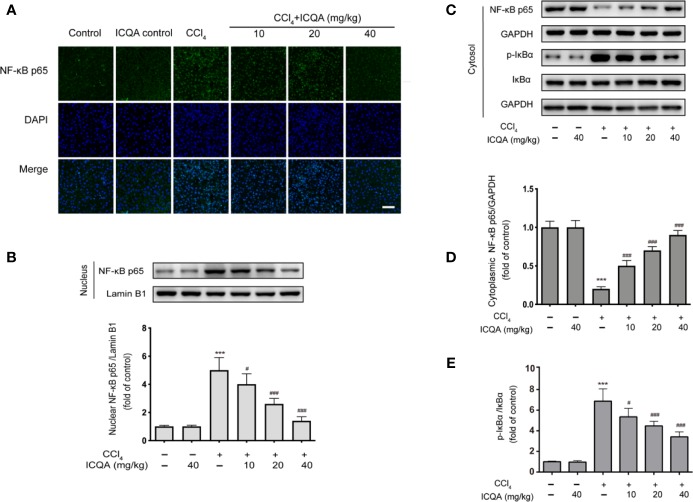
Figure 8.
Effects of ICQA on the NF-κB activation in liver of CCl4 treated rats. (A) Fluorescent micrographs of NF−κB p65-loaded liver section (scale bar = 50 μm); (B) protein expression of NF-κB p65 in the nuclear fraction of rat liver; (C–E) protein expression of NF-κB p65, p-IκBα and IκBα in the cytoplasmic fraction of rat liver. Data were expressed as mean ± SD, ***P < 0.001 vs. control group; #P < 0.05, ##P < 0.01, ###P < 0.001 vs. model group.

