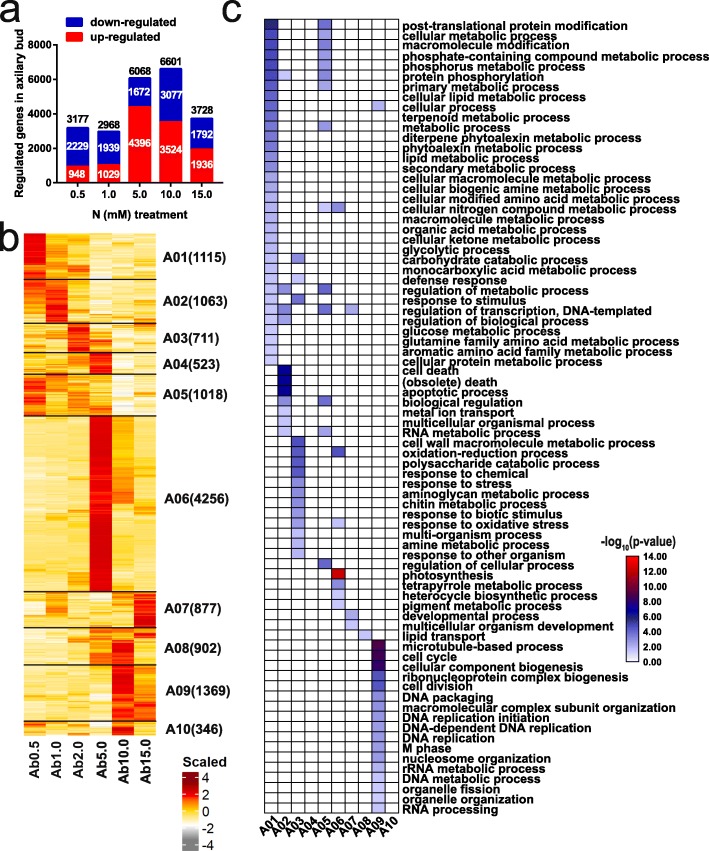
Fig. 5.
Differentially expressed genes in axillary bud under under N concentrations. a The number of up and down-regulated DEGs (fold change> 2 and padj< 0.05 by DESeq2) detected between each N stress concentrations (0.5, 1.0, 5.0, 10.0, 15.0 mM) and the optimal concentration (2.0 mM) in axillary bud. 0.5 and 1.0 mM N are low nitrogen (LN) concentrations, while 5.0, 10.0, and 15.0 mM are high nitrogen (HN) concentrations. The number of up-, down- regulated and total DEGs were shown. b Clustering of the total DEGs in axillary bud under N stress. FPKM values were scaled per gene across basal part samples and shown as the scaled expression. Ab stands for axillary bud. The number of genes in each cluster is indicated beside the cluster name. c Enriched Gene Ontology (GO) terms within the category of biological process for the ten clusters shown in (b). Only significant GO terms (false discovery rate (FDR) < 0.05) are displayed

