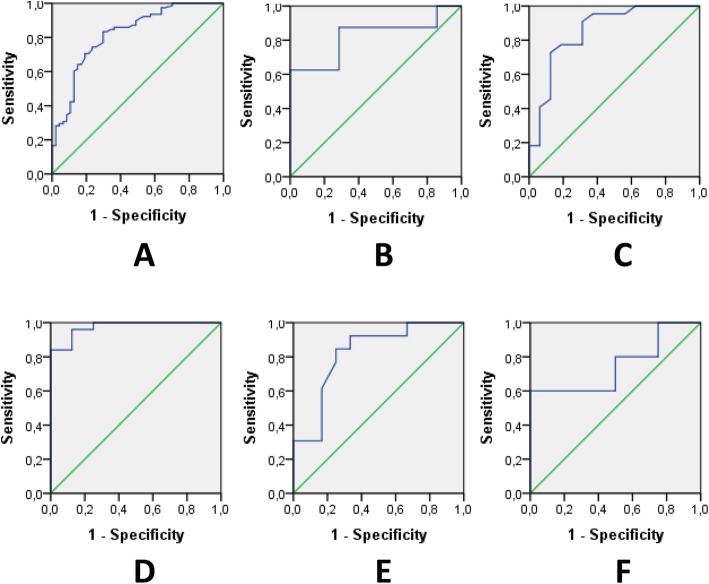
Fig. 3.
ROC curves for serum IGF-1 level and MDD status. a ROC curve to diagnose MDD in all age groups (18–65 y.o.) (p < 0.0001, AUC: 0.820; sensitivity: 83% and specificity: 71% for a cutoff of 178.00 ng/ml). b ROC curve to diagnose MDD in group 1 (18–24 y.o.) (p = 0.037, AUC: 0.821; sensitivity: 88% and specificity: 71% for a cutoff of 209.50 ng/ml). c ROC curve to diagnose MDD in group 2 (25–34 y.o.) (p < 0.0001, AUC: 0.855; sensitivity: 86% and specificity: 69% for a cutoff of 185.50 ng/ml). d ROC curve to diagnose MDD in group 3 (35–44 y.o.) (p < 0.0001, AUC: 0.975; sensitivity: 84% and specificity: 100% for a cutoff of 178 ng/ml). e ROC curve to diagnose MDD in group 4 (45–54 y.o.) (p = 0.007, AUC: 0.821; sensitivity: 85% and specificity: 75% for a cutoff of 176.00). f ROC curve to diagnose MDD in group 4 (55–65 y.o.) (p = 0.16, AUC: 0.750). AUC: area under the ROC curve; ROC: receiver-operating characteristic.

