Fig. 2.
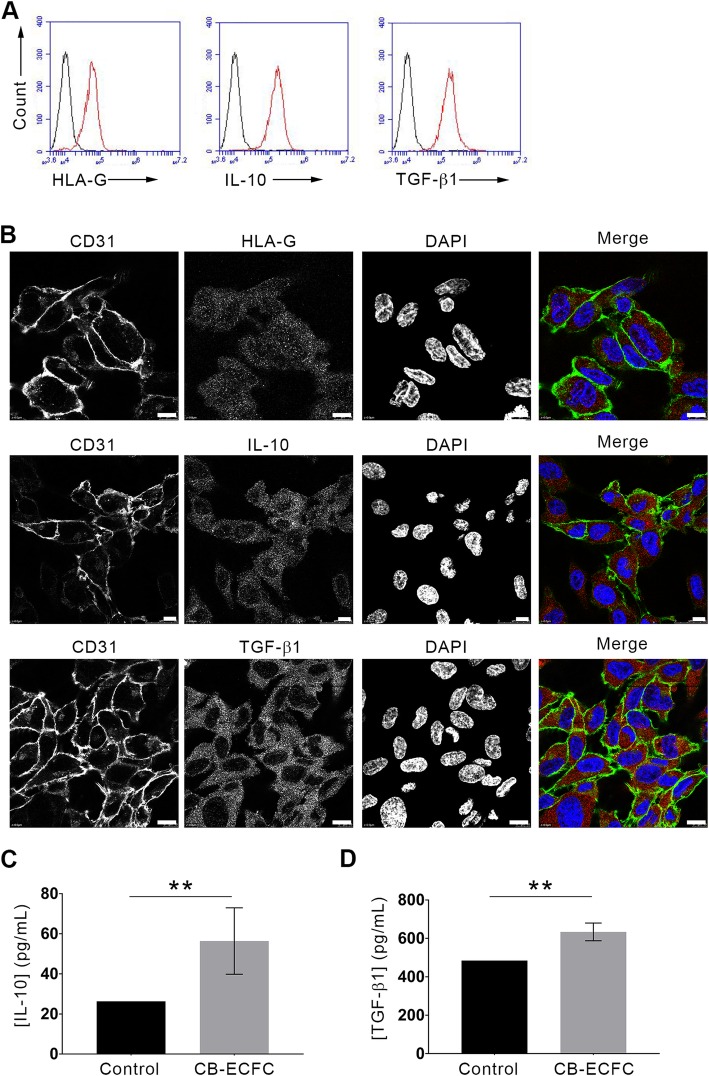
CB-ECFCs express immunosuppressive markers HLA-G, IL-10, and TGF-β1. a After fixation and permeabilization, CB-ECFCs were stained with anti-HLA-G5 (clone 2A12), anti-IL-10 (clone B-S10), and anti-TGF-β1 (clone #27235) antibodies. Protein expressions were monitored and analyzed on a BD Accuri™ C6 flow cytometer. Data are mean fluorescence intensities (MFI); representative histograms of 3 experiments are shown (black curves, IgG isotype control; red curves, markers). b CB-ECFCs were grown on glass coverslips, fixed, permeabilized, and stained (left panels, CD31 staining; middle left panels: HLA-G5 or IL-10 or TGF-β1 staining; middle right panels, DAPI staining; right panels, merges). Scale bars represent 10 μm. Representative images of 3 experiments are shown. c, d CB-ECFCs were grown for 24 h in EBM-2 supplemented with 5% FBS. Supernatants were collected and ELISAs were performed to quantify IL-10 (c) and TGF-β1 (d). Data are given as histograms representing means ± SD of 5 distinct CB-ECFCs; **p < 0.01; Mann-Whitney test

