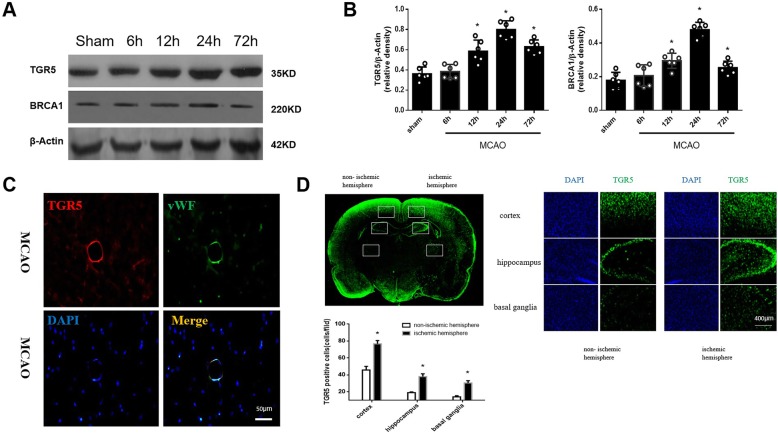
Fig. 2.
Expression of TGR5 and BRCA1 in the right hemisphere of the rat brain after MCAO. a, b Representative Western blot images and quantitative analyses of TGR5 and BRCA1 time-course expression after MCAO. n = 6 per group. c Double immunofluorescence staining revealed that both TGR5 (red) was predominantly expressed in vWF positive- endothelial cells (green) in penumbra at 24 h after MCAO. n = 4 per group. *P < 0.05 vs sham group. Bars represent mean ± SEM. Scale bar, 50 μm. vWF, Von Willebrand factor. d Whole brain immunofluorescence staining showed that TGR5 expression was upregulated in the cortex, hippocampus and basal ganglia 24 h after MCAO. n = 4 per group. *P < 0.05 vs contralateral non-ischemic hemisphere. Bars represent mean ± SEM. Scale bar, 400 μm

