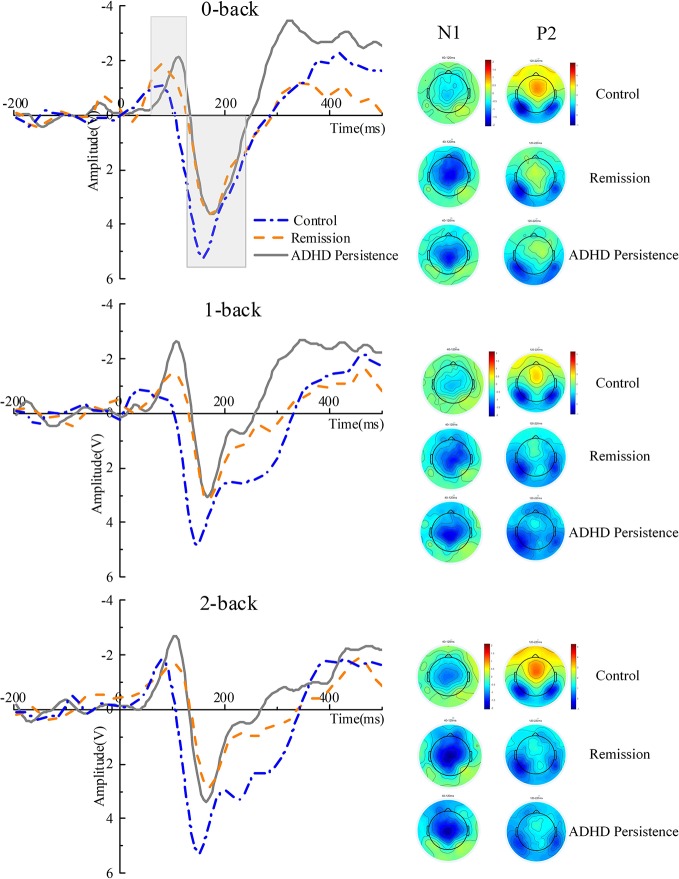
Figure 3.
ERP waveforms at Fz and topographic maps. The N1 and P2 were quantified as the maximum negatively between 40 and 120 ms and positively between 120 and 220 ms, respectively, after stimulus-onset at electrode site Fz during the n-back task. The time window of the topographic map is the same as the N1 and P2, respectively.

