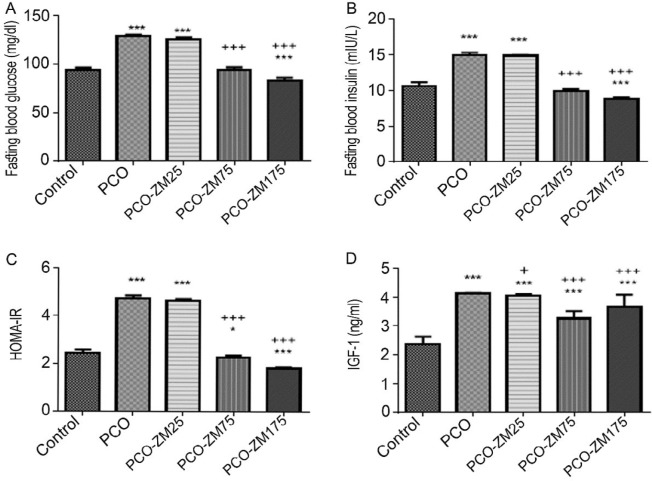
Figure 1.
The effects of different levels of zinc-methionine supplementation on blood glucose (A), insulin (B), HOMA IR (C), and IGF1 (D). The data are presented as mean SD *, **, and ***, respectively show significant differences at the levels of P<0.05, P<0.01, and P<0.001, between the healthy control group and PCO groups. +, ++, and +++ showed significant differences between PCO treated groups with zinc-methionine and PCO control group at P<0.05, P<0.01, and P<0.001, respectively. Control: Healthy control group; PCO: Polycystic ovary control group; PCO-ZM 25, PCO-ZM 75, and PCO-ZM175 groups: polycystic groups treated with 25, 75, and 175 mg zinc-methionine; respectively

