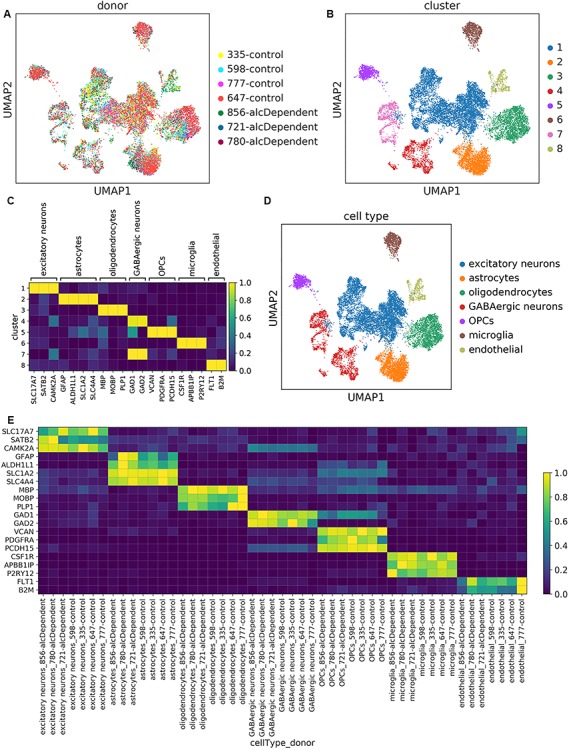
Figure 1.

Unsupervised clustering captured expected cell types in every sample. (A) UMAP plots of the 16 305 nuclei in our dataset, colored by donor or (B) transcriptomically distinct clusters determined from unsupervised clustering. (C) Scaled mean expression of known cell type markers in the different clusters. For each gene, expression was scaled from 0.0 to 1.0 to maintain a balanced colormap. (D) UMAP plot of nuclei colored by cell type assignment. (E) Scaled mean expression of marker genes for each cell type in each donor.
