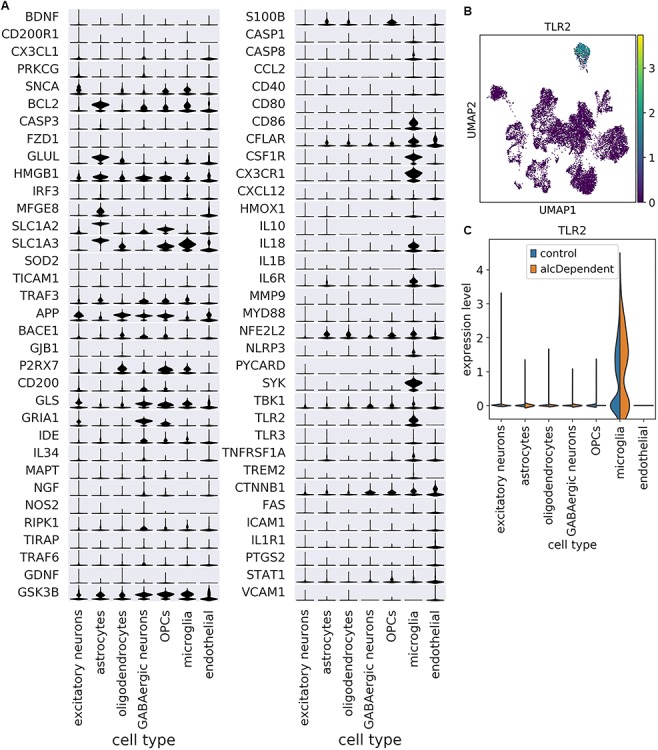
Figure 2.

Cell type enrichment patterns vary among neuroimmune genes. (A) Scaled expression of neuroimmune genes among cell types. Genes are ordered by which cell type had the highest mean expression. Scaling was done for each gene across all cells. (B) UMAP plot depicting expression of TLR2 as an example of a gene that is enriched in a specific cell type (microglia). (C) TLR2 expression is enriched in microglia among nuclei from both controls and alcoholics.
