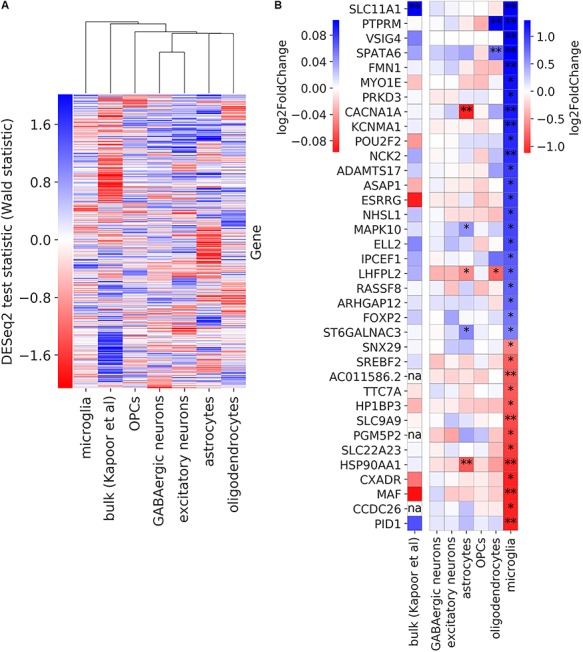
Figure 4.

Comparison of alcohol dependence-associated DE from human bulk RNA-seq and snRNA-seq data. (A) Gene expression changes in alcoholics for each cell type as well as bulk data from a previous study (3). Groups were hierarchically clustered using average as the linkage method. (B) Log fold change of expression in alcohol-dependent donors compared with controls for genes that are differentially expressed (FDR < 0.25) in microglia. A single asterisk indicates DE at FDR < 0.25, while a double asterisk indicates FDR < 0.05. The three genes with ‘na’ are non-protein-coding genes, which had not been included in the bulk study.
