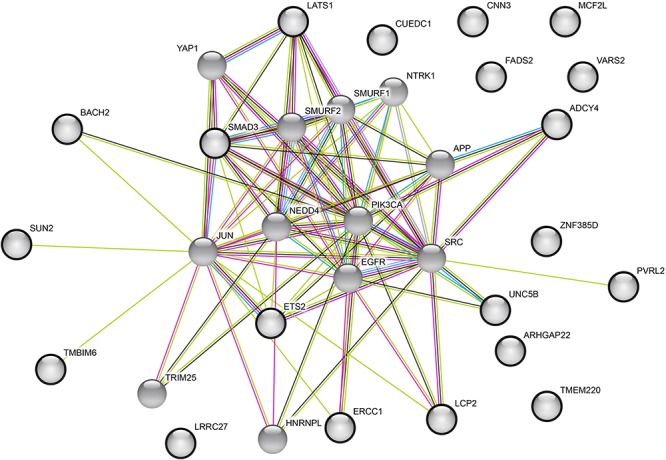
Figure 3.

The protein–protein interaction network with the 21 candidate genes and their top 13 interaction partners as input variables analyzed using the STRING database. The top 13 interaction partners were selected based on the InterMine database. The colored edges represent the types of evidence used in the interaction predictions by the STRING software: experimental evidence (dark pink), text mining evidence (light green), database evidence (light blue), protein homology evidence (purple), and co-expression evidence (black). The 21 candidate genes are indicated by bold circles.
