
Figure 2.
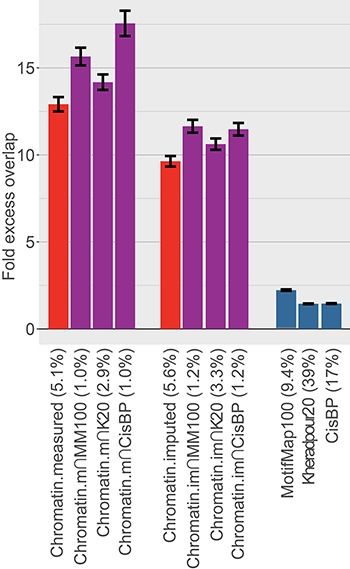
Comparison of excess overlap with TF ChIP-seq. We report the fold excess overlap with TF ChIP-seq peaks from ENCODE cell line GM12878 (LCL; data available from 91 experiments for 76 TFs) for sequence-based TF-binding annotations (blue bars), cell type-specific chromatin annotations (red bars) and cell type-specific TF-binding annotations (purple bars). Error bars denote one SE. The percentage under each bar indicates the proportion of SNPs in each annotation. Numerical results, including results for five other tissues for which ChIP-seq TF-binding data were available for at least 20 TFs, are reported in Supplementary Material, Table S1.