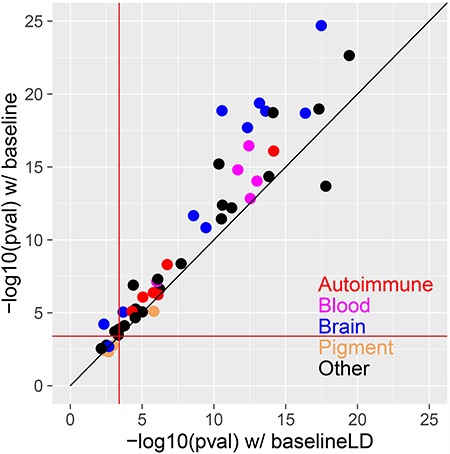
Figure 6.

Comparison of combined cell type-specific annotations (Chromatin + Chromatin∩MotifMap100) conditioned on the baseline vs. baseline-LD models. We report the statistical significance (–log10P-value of combined τ*) of the combined cell type-specific annotations (Chromatin + Chromatin∩MotifMap100) for the baseline (y-axis) vs. baseline-LD (x-axis) models, for each of 49 traits. In each case, we report results for the most significant tissue/cell type. The red lines indicate the P = 0.05/127 significance threshold, correcting for testing of 127 cell types. Numerical results are reported in Supplementary Material, Table S5.
