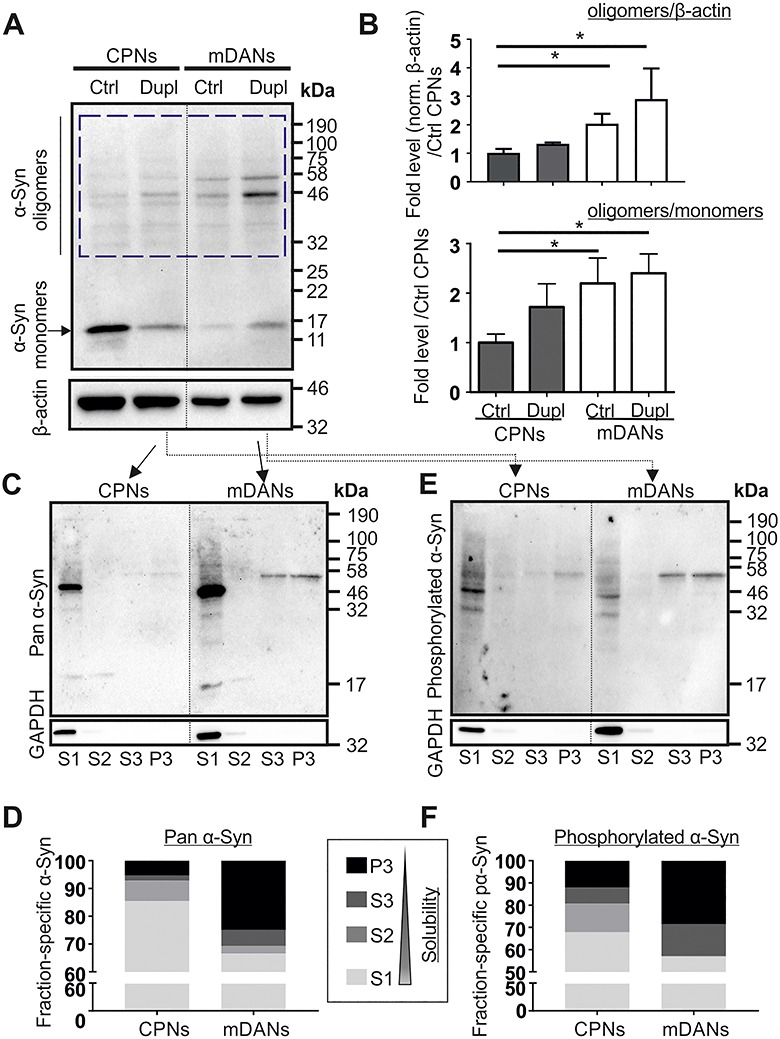
Figure 2.

Higher α-Syn aggregation levels in mDANs compared with CPNs in PD Dupl case. (A) High molecular weight SDS-stable α-Syn oligomers were determined by WB using a pan α-Syn antibody (Syn1). β-Actin was used as a loading control and was probed on the same membrane. (B) α-Syn oligomer level in each sample was quantified by measuring the signal intensity in the region ranging from 32 kDa (corresponding to the molecular weight of α-Syn dimers) to 190 kDa (blue dashed box in A). Quantifications were performed by the normalization of signals either to β-actin levels (in order to determine the levels of α-Syn oligomers) or to α-Syn monomer (to analyze relative ratios of α-Syn oligomers to monomers in each sample) followed by setting Ctrl CPN levels to 1 (upper and lower diagrams, respectively). PD Dupl mDANs exhibit the highest α-Syn oligomer levels as shown in the representative WB (A) and by quantifications (B). Numbers on the right of the WB panel represent molecular weights of a protein ladder in kDa. Values are shown as mean ± SD of three independent experiments. *P ≤ 0.05 by one-way ANOVA. (C–F) The solubility of α-Syn was determined by sequential extraction of proteins, followed by WB analysis of α-Syn distribution in fractions carrying proteins with decreasing solubility (solubility S1 > S2 > S3 > P3 fractions). GAPDH, a soluble cytosolic protein, was probed on the same membranes for α-Syn to control the sequential extraction. α-Syn and phosphorylated α-Syn (S129) in different fractions were probed using (C and D) a pan α-Syn antibody and (E and F) a phosphorylated α-Syn antibody, respectively. Solubility analysis reveals a decreased α-Syn solubility and increased formation of insoluble phosphorylated α-Syn species. A prominent band between 46 and 58 kDa found in S3 and P3 fractions derived from PD Dupl mDANs represents phosphorylated oligomeric α-Syn. Quantification shown in (D) and (F) was done by calculating the proportion of α-Syn positive signals (from monomeric and oligomeric α-Syn) in each fraction. Blots for α-Syn within one black frame (in C and E) are derived from the same membrane. GAPDH was probed on the same membrane as α-Syn. Lanes from different parts of the same membrane are separated by black dashed lines.
