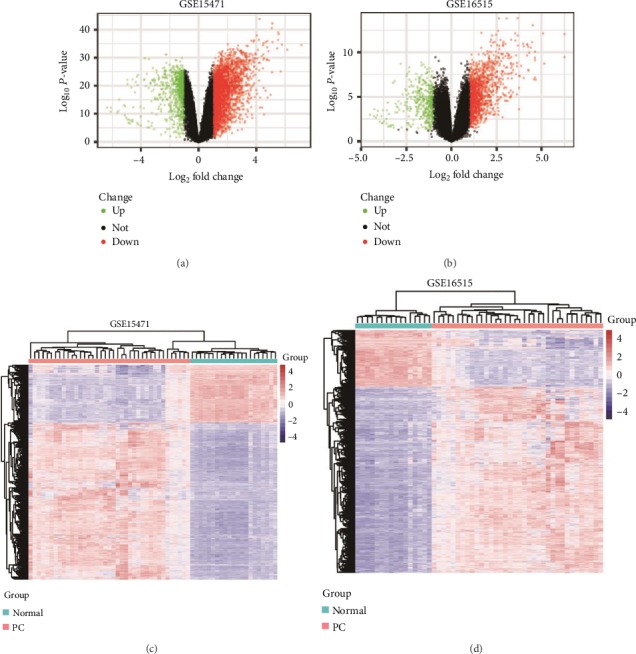
Figure 1.

Differential expression analysis. (a) Volcano plot of DEGs in the GSE15471 dataset. (b) Volcano plot of DEGs in the GSE16515 dataset. Red dots indicate upregulated genes; green dots indicate downregulated genes; and black dots indicate unaltered genes. (c) Hierarchical clustering heatmap of DEGs in the GSE15471 dataset. (d) Hierarchical clustering heatmap of DEGs in the GSE16515 dataset. Blue represents downregulated genes, and red represents upregulated genes.
