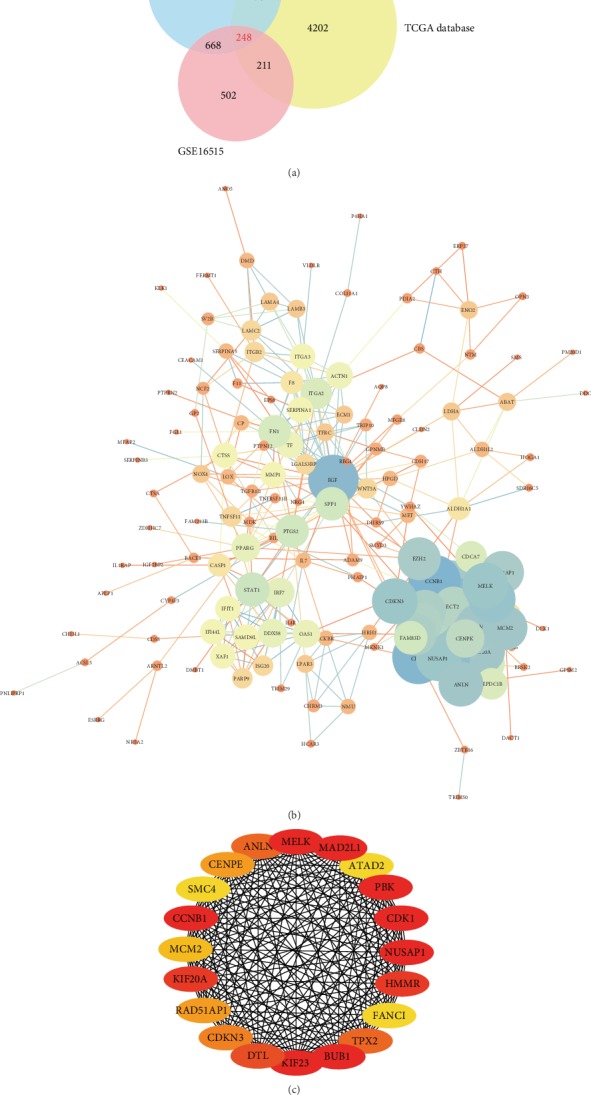
Figure 2.

Venn diagram and the PPI network. (a) Venn diagram of the overlapping DEGs in the three datasets. (b) PPI network of DEGs. The size of the circle indicates the weight of the gene action; the line indicates the interaction between the genes, and the thickness of the line indicates the strength of the interaction. (c) Twenty hub genes. A darker color represents a higher score, and a lighter color represents a lower score.
