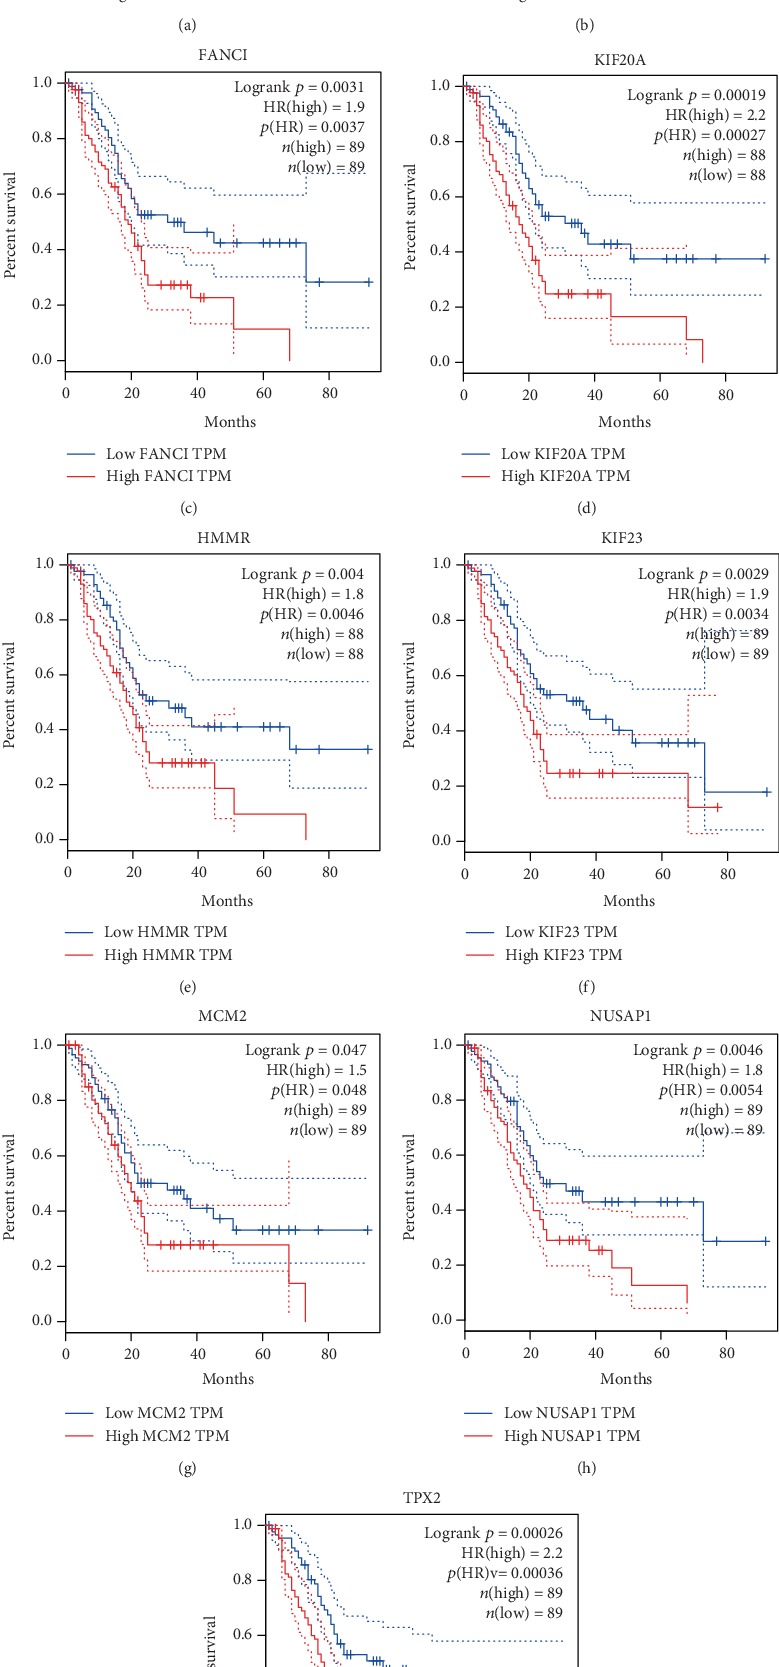
Figure 5.

Association of hub gene expression with overall survival of patients. (a) BUB1, (b) CDK1, (c) FANCI, (d) KIF20A, (e) HMMR, (f) KIF23, (g) MCM2, (h) NUSAP1, and (i) TPX2. The solid line represents the survival curve, and the dashed line represents the 95% confidence interval. Patients with higher than the median value are indicated by the red line, and those with lower than the median value are indicated by the blue line. Log-rank P < 0.05 was considered statistically significant.
