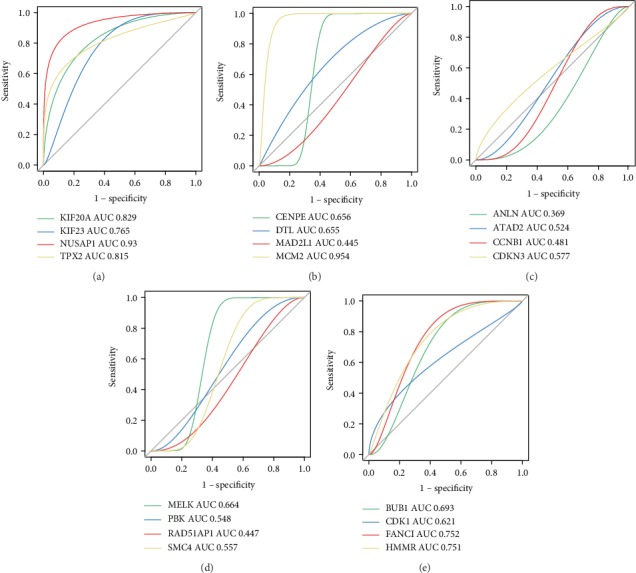
Figure 6.

Analysis of the diagnostic value of the hub genes using ROC curve analysis. (a) KIF20A, KIF23, NUSAP1, and TPX2. (b) CENPE, DTL, MAD2L1, and MCM2. (c) ANLN, ATAD2, CCNB1, and CDKN3. (d) MELK, PBK, RAD51AP1, and SMC4. (e) BUB1, CDK1, FANCI, and HMMR. AUC represents the area under the ROC curve.
