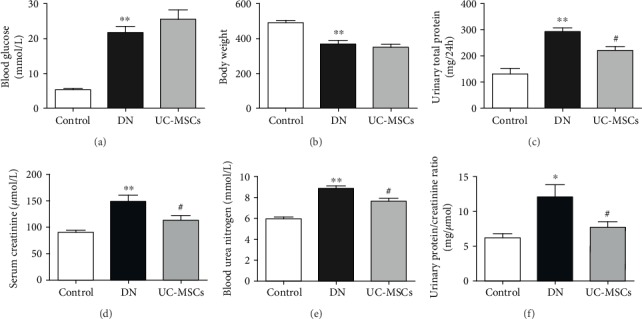
Figure 2.

Physical and biochemical analysis of rats. The diabetic model was established by increased blood glucose (a) and reduced body weight (b). Renal function of rats was assessed by 24-hour urinary total protein (c), serum creatinine (d), blood urea nitrogen (e), and urinary protein/creatinine ratio (f) (n = 4~5, ∗p < 0.05 versus control group, ∗∗p < 0.01 versus control group, and #p < 0.05 versus DN group).
