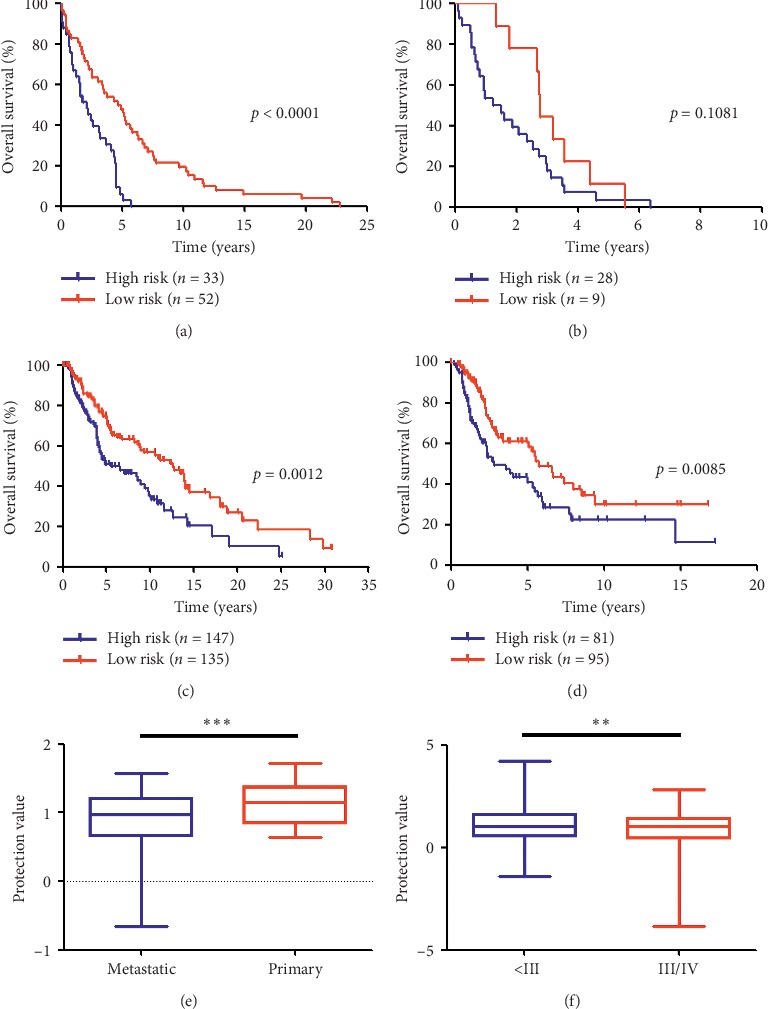
Figure 3.

Associations between the local gene signature and clinicopathological features in melanoma. (a) Survival curves of overall survival in high- and low-risk groups classified by the local gene signature in metastatic melanoma patients (GEO database). (b) Survival curves of overall survival in high- and low-risk groups classified by the local gene signature in primary melanoma patients (GEO database). (c) Survival curves of overall survival in high- and low-risk groups classified by the local gene signature in AJCC stage I/II melanoma patients (TCGA database). (d) Survival curves of overall survival in high- and low-risk groups classified by the local gene signature in stage III/IV melanoma patients (TCGA database). (e) Associations between the protection value and the clinicopathological features (Primary vs. Metastatic). (f) Associations between the protection value and the clinicopathological features (Stage I/II vs. Stage III/IV).
