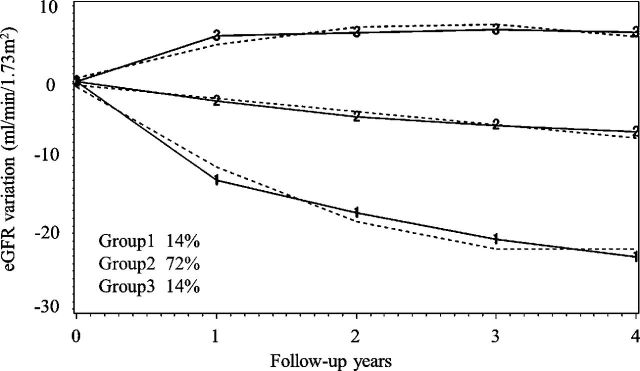
Figure 2.
Yearly estimated glomerular filtration rate (eGFR) variation divided into three groups and modeled in a trajectory analysis. The solid lines show the actual transit, while the broken lines show the estimated trajectory of eGFR. Group 1 shows the feature of rapid decliners, existed 14% of all.

