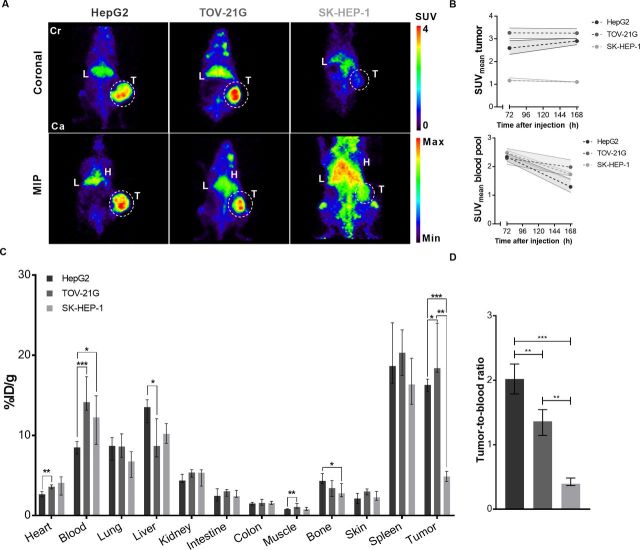
Figure 2.
[89Zr]Zr-N-suc-Df-ERY974 distribution in immunodeficient NOG mice bearing different tumor xenografts. (A) Coronal microPET images (upper panel) and maximal intensity projection (MIP) images (lower panel) of NOG mice bearing HepG2, TOV-21G or SK-HEP-1 xenografts (white circle) 168 hours post 10 µg [89Zr]Zr-N-suc-Df-ERY974 injection. (B) Quantification of HepG2 (n=6), TOV-21G (n=6) or SK-HEP-1 (n=6) uptake of [89Zr]Zr-N-suc-Df-ERY974 (upper graph) and corresponding blood pool uptake (lower graph) at 72 hours and 168 hours post-tracer injection. Data shown as median SUVmean and IQR. (C) Ex vivo biodistribution of [89Zr]Zr-N-suc-Df-ERY974 168 hours post-tracer administration. Data are expressed as median with IQR. *P≤0.05; **P≤0.01; ***P≤0.001 (Mann-Whitney U). (D) Tumor-to-blood ratio based on ex vivo biodistribution of C. Data are expressed as median with IQR. **P≤0.01; ***P≤0.001 (Mann-Whitney U). Cr, cranial; Ca, caudal; H, heart; L, liver; PET, positron emission tomography; SUVmean, standardised uptake value; T, tumor; 89Zr, zirconium-89.

