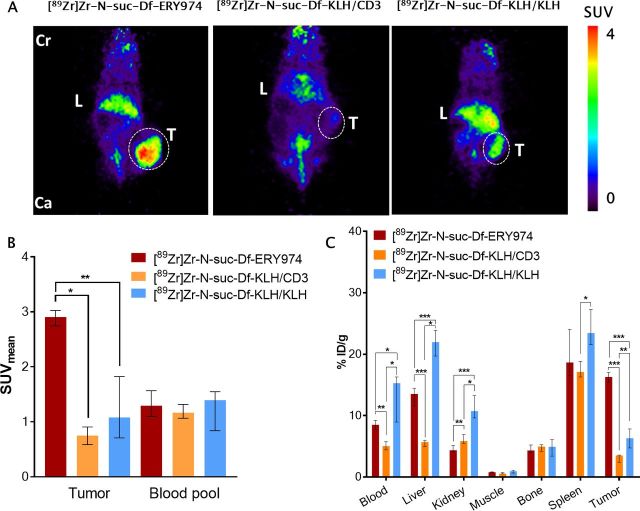
Figure 3.
Distribution of [89Zr]Zr-N-suc-Df-ERY974 and control tracers in HepG2 xenograft bearing immunodeficient NOG mice (A) coronal microPET images of HepG2 (white dotted circle) bearing NOG mice injected with 10 µg [89Zr]Zr-N-suc-Df-ERY974, [89Zr]Zr-N-suc-Df-KLH/CD3 or [89Zr]Zr-N-suc-Df-KLH/KLH 168 hours post tracer injection. (B) Quantification of [89Zr]Zr-N-suc-Df-ERY974 (n=6), [89Zr]Zr-N-suc-Df-KLH/CD3 (n=5) or [89Zr]Zr-N-suc-Df-KLH/KLH (n=6) uptake in HepG2 tumor and blood pool. Data shown as median SUVmean and IQR. *P≤0.05; **P≤0.01 (Mann-Whitney U). (C) Ex vivo biodistribution of [89Zr]Zr-N-suc-Df-ERY974, [89Zr]Zr-N-suc-Df-KLH/CD3 and [89Zr]Zr-N-suc-Df-KLH/KLH 168 hours post-tracer administration. Data are expressed as median with IQR. *P≤0.05; **P≤0.01; ***P≤0.001 (Mann-Whitney U). Cr, cranial; Ca, caudal; KLH, keyhole limpet hemocyanin; L, liver; PET, positron emission tomography; SUVmean, standardised uptake value; T, tumor; 89Zr, zirconium-89.

