
Figure 5.
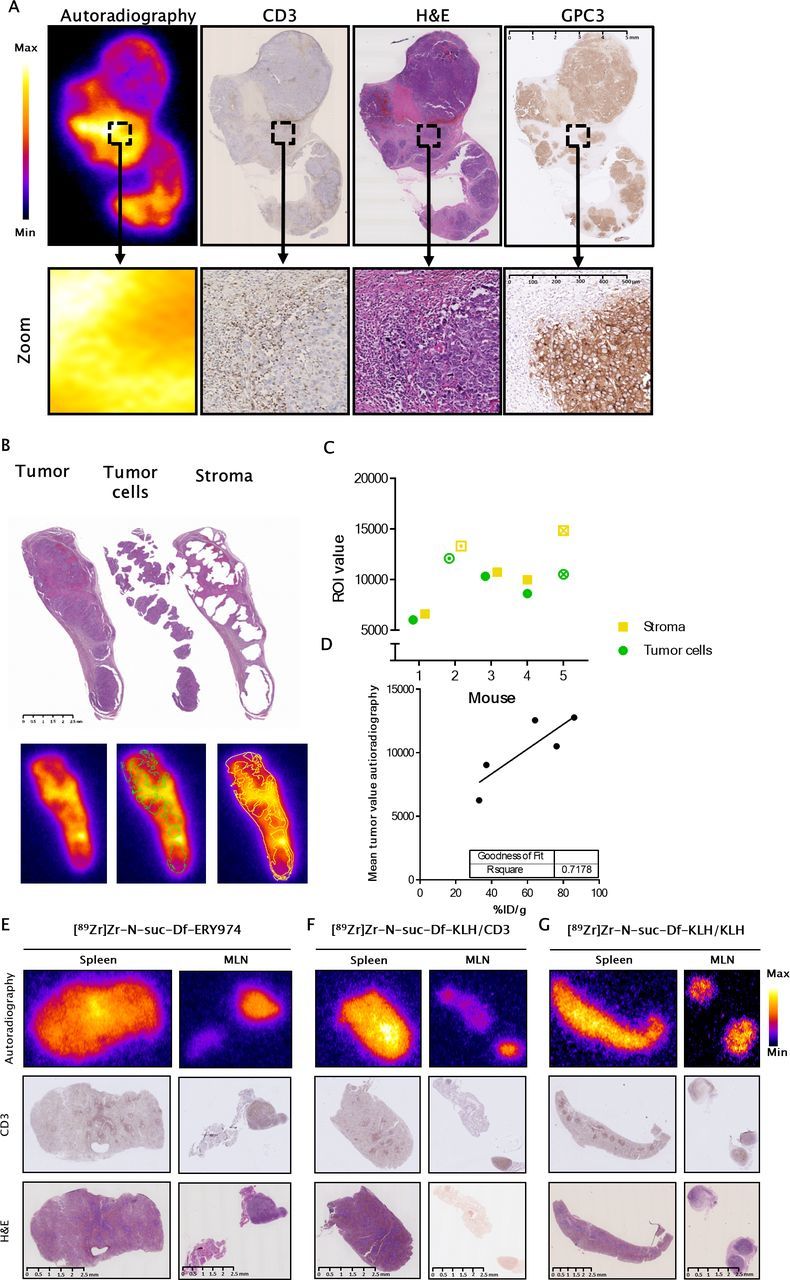
Intratumoral distribution of [89Zr]Zr-N-suc-Df-ERY974 in HepG2 bearing huNOG mice (A) autoradiography (first panel) of [89Zr]Zr-N-suc-Df-ERY974 in HepG2 bearing huNOG mice with subsequent slides stained for human CD3 (second panel), (H&E; third panel) and human GPC3 (fourth panel). Scale bar length represents 5 mm for whole tissue and 500 µm for magnified tissue. (B) ROI drawing of tumor cells and stromal regions based on H&E staining (upper panel) and the overlay on autoradiography (lower panel). Scale bar length represents 2.5 mm. (C) Quantification of tumor and stromal regions on autoradiography. Circle and square with an inner dot represent the quantification of the tumor and stroma shown in (B). Checked circle and square represents the quantification of tumor and stroma depicted in (A). (D) Mean total tumor value on autoradiography correlated with the %ID/g of the same tumor. (E) Autoradiography (top panel), CD3 immunohistochemistry (middle panel) and H&E staining (bottom panel) of spleen and mesenteric lymph node (MLN) of huNOG mice injected with [89Zr]Zr-N-suc-Df-ERY974. Autoradiography and H&E were performed on the same slide. scale bar length represents 2.5 mm. (F) Autoradiography (top panel), CD3 immunohistochemistry (middle panel) H&E staining (bottom panel) of spleen and MLN of huNOG mice injected with [89Zr]Zr-N-suc-Df-KLH/CD3. Scale bar length represents 2.5 mm. (G) Autoradiography (top panel), CD3 immunohistochemistry (middle panel) and H&E staining (bottom panel) of spleen and MLN of huNOG mice injected with [89Zr]Zr-N-suc-Df-KLH/KLH. Scale bar length represents 2.5 mm. GPC3, glypican 3; huNOG, humanised NOG; KLH, keyhole limpet hemocyanin; 89Zr, zirconium-89.