
Figure 2.
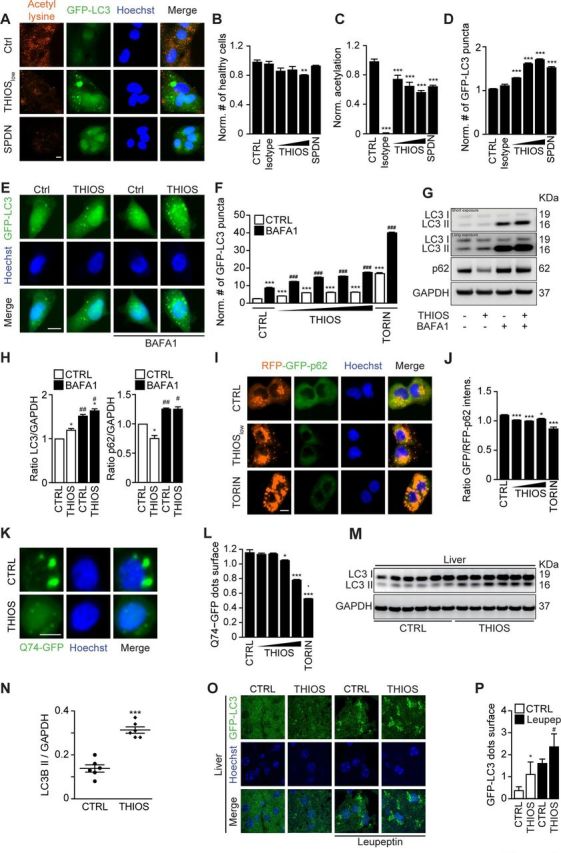
Thiostrepton induces autophagic flux. (A–D) Human osteosarcoma U2OS cells stably expressing GFP-LC3 were treated with thiostrepton (THIOS; 1, 3, 9 µM), spermidine (SPDN; 200 µM), or vehicle (CTRL) for 6 hours. The cells were fixed and acetylated tubulin was blocked by means of a specific antibody. Thereafter, cytoplasmic fluorescence intensity of acetylated lysine residues was assessed by appropriate Alexa Fluor 568-conjugated secondary antibodies (A). All data were normalized to controls (CTRL). Viable cells with regular nuclear phenotype are shown in (B). Protein acetylation are shown in (C), and GFP-LC3 dots were counted as a proxy for autophagic activity in (D). Representative images of acetylation and GFP-LC3 are shown in (A). Scale bar equals 10 µm. Data are means±SD of four replicates (**p<0.01, ***p<0.001; Student’s t-test). (E, F) Human glioma H4 cells stably expressing GFP-LC3 were treated with thiostrepton (1.9, 5.6, 16.7 and 50 µM), torin 1 (TORIN, 300 nM), or vehicle (CTRL), with or without bafilomyicn A1 (BAFA1) for 6 hours. GFP-LC3 dots were counted to assess autophagic activity. Representative images of GFP-LC3 are shown in (E). Data are means±SD of four replicates (***p<0.001; Student’s t-test). (G, H) H4 wild-type cells were treated with thiostrepton (5 µM) or vehicle (CTRL), with or without BafA1 for 6 hours. Then cells were processed to measure LC3 and p62 protein levels by SDS–PAGE and immunoblot. GAPDH was used as a loading control. The experiments were repeated at least three times. Band intensities of p62, GAPDH, and LC3-II were measured, and ratios of p62 or LC3-II versus GAPDH (LC3-II/GAPDH, p62/GAPDH) were calculated in (H). Data are means±SEM of three independent experiments (*p<0.05 compared with untreated CTRL; #p<0.05, ##p<0.01, compared with no BAFA1; paired Student’s t-test). (H–I) U2OS cells stably expressing RFP-GFP-p62 tandem reporter were treated with thiostrepton (15, 30, 60 µM), vehicle (CTRL), or torin 1 (TORIN, 300 nM). GFP and RFP intensity were measured. The ratio of GFP/RFP intensity indicated p62 degradation (I). Representative images of RFP-GFP-p62 are shown in (I). Data are means±SD of four replicates (*p<0.05, ***p<0.001; Student’s t-test) (J). (K, L) Rat adrenal gland PC12 cells expressing inducible variant of Q74-GFP cells were treated with doxycycline (1 µg/mL) for 8 hours for the induction of Q74 expression. Then the medium was changed and thiostrepton (0.25, 0.5, 1, 2 µM), torin 1 (TORIN, 300 nM), or vehicle (CTRL) were added for 24 hours. The cells were fixed and GFP-Q74 dots were counted to assess Q74 degradation (L). Representative images of GFP-Q74 are shown in (K) (*p<0.05, ***p<0.001; Student’s t-test). (M, N) C57BL/6 mice were injected intraperitoneally with thiostrepton (200 mg/kg) or vehicle for 24 hours every day for 3 days, and tissues were collected 6 hours after the last injection. Then the tissue was subjected to SDS–PAGE and immunoblot (M). GAPDH was measured as a loading control. Band intensities of GAPDH and LC3-II were measured, and the ratio of LC3-II versus GAPDH (LC3-II/GAPDH) was calculated in (N). Data are means±SEM of 6 mice per group (***p<0.001; Student’s t-test). (O–P) GFP-LC3-expressing mice were i.p. injected with thiostrepton for three times (same as the first three times in tumor growth experiments). Leupeptin (Leu) was used to test autophagic flux in vivo, and GFP-LC3 dots were measured in liver tissue. Data are means±SEM of at least three mice (*p<0.05 vs CTRL without Leu; #p<0.05 vs CTRL with Leu; Student’s t-test).