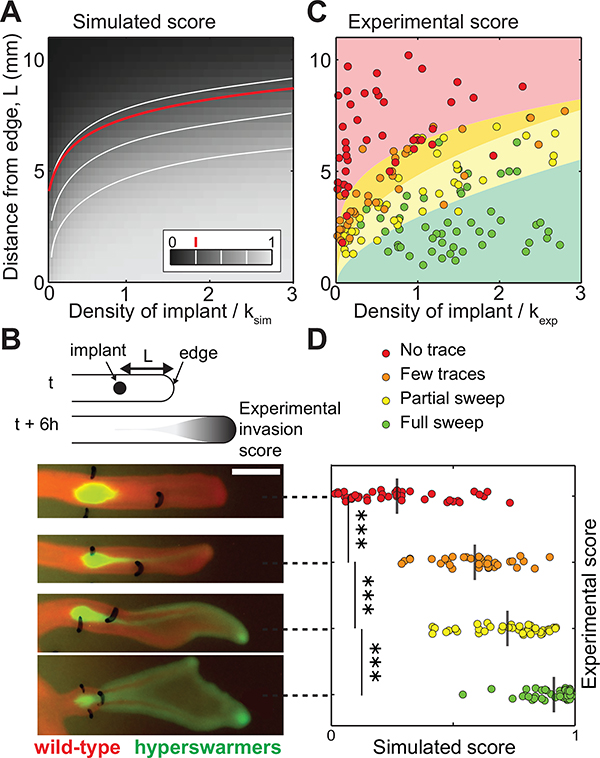
Figure 3:
Likelihood of fixation increases with the initial size of the introduced population and its proximity to the population edge. A: Simulation results of introducing species 2 into an expanding species 1. The color scale represents the simulated sweep score, i.e. the frequency f of the introduced species (species 2 with D2 = 2D1 and r2 = 0.9r1) at the population edge T = 6 h after introduction. White lines are iso-frequency lines for f = 0.25, 0.5, and 0.75. The red line is from Eq. 6 for f = 0.25. B: Laboratory experiments where the hyperswarmer (in green) was introduced at varying initial densities and distances to the edge of an expanding swarm of wild-type P. aeruginosa (in red). Scale bar is 5 mm. Leftmost marks depict the location of the hyperswarmer introduction; rightmost marks locate the position of the front of the P. aeruginosa population at the time of hyperswarmer implantation. The four snapshots represent four experimental replicates. C: Experimental sweep success evaluated visually at 6 hours after hyperswarmer introduction. Background colors represent results from multinomial logistic regression (see details in Appendix D: Statistical analysis). In agreement with the theory, sweep success is lower for large distances from the front and smaller initial densities. D: Comparison of simulated and experimental sweep scores for each experimental replicate. The grey vertical lines represent the average simulated sweep score and the p-values are < 10−3 (Kruskal-Wallis test). secrete molecules that are auto-fluorescent, and the long-term maturation kinetics of the fluorescent proteins used (GFP and DsRed) can vary. Therefore, the situation may start to differ from the idealized model. Once the edge has passed the dynamics can be quite different: in the resource-depleted region, the population is denser and covers the entire available area (Fig. S2). The spatial structure and dispersal are less relevant and the evolutionary fate of a new mutant is determined by high-density dynamics. The faster growing wild-type can catch up or new mutants carrying compensatory mutations that thrive in low resource environments may even appear (Yan et al. 2017). These successional dynamics may be a natural product of evolution, so long as there is someplace for the faster disperser to utilize.

