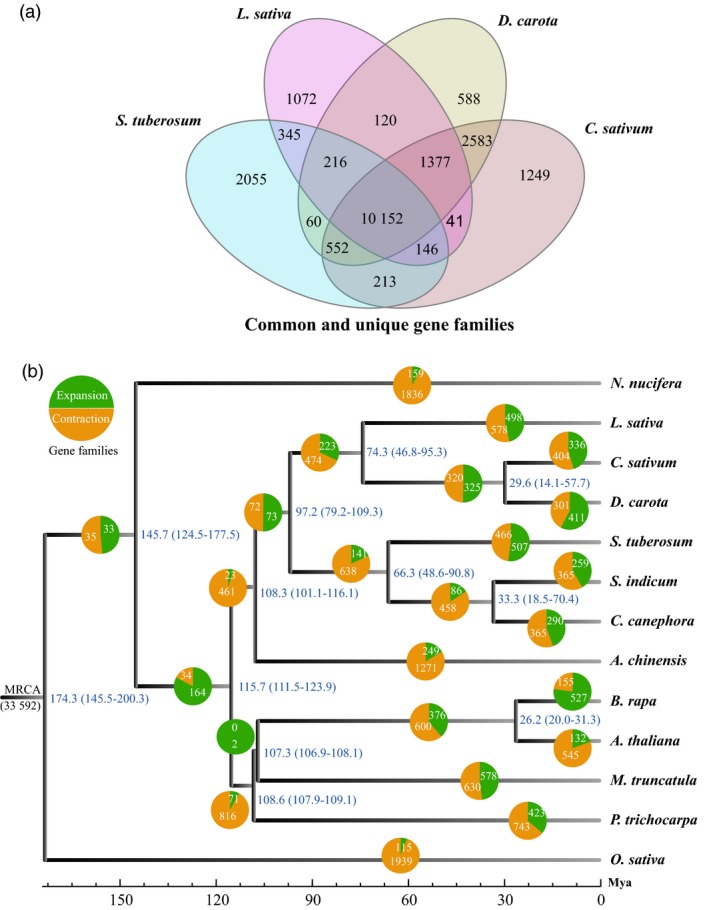
Figure 2.

Coriander gene family analyses. (a) Common and lineage‐specific gene families in carrot (D. carota), potato (S. tuberosum), lettuce (L. sativa) and coriander (C. sativum). (b) Divergence time estimation and gene family expansion/contraction analyses. The numbers on the nodes represent the divergence time of the species (million years ago, Mya), with confidence range in brackets. The green and orange pies indicate the gain (expansion) and loss (contraction) number of gene families.
