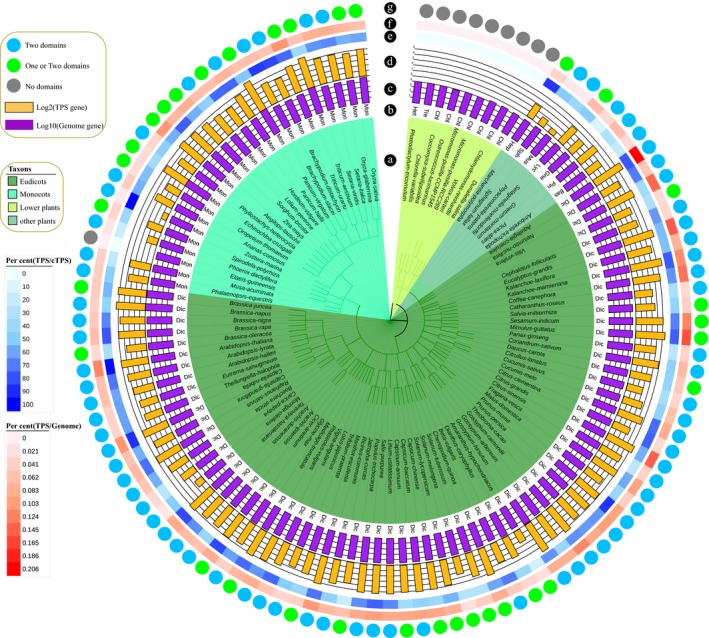
Figure 6.

Comparative analysis of the TPS gene family of coriander and 112 representative plants, including eudicots, monocots, lower plants and other plants. Colours indicate that all TPS genes of one species contain two domains (blue); TPS genes of one species contained one or two domains (green); or there were no TPS genes (grey). The orange and purple colours represent the TPS genes and genome gene numbers transformed by log2 and log10, respectively. The gradient from blue to white represents the percentage of TPS/cTPS (candidate TPS). The gradient from red to white represents the percentage of TPS/Genome genes.
