
Figure 1.
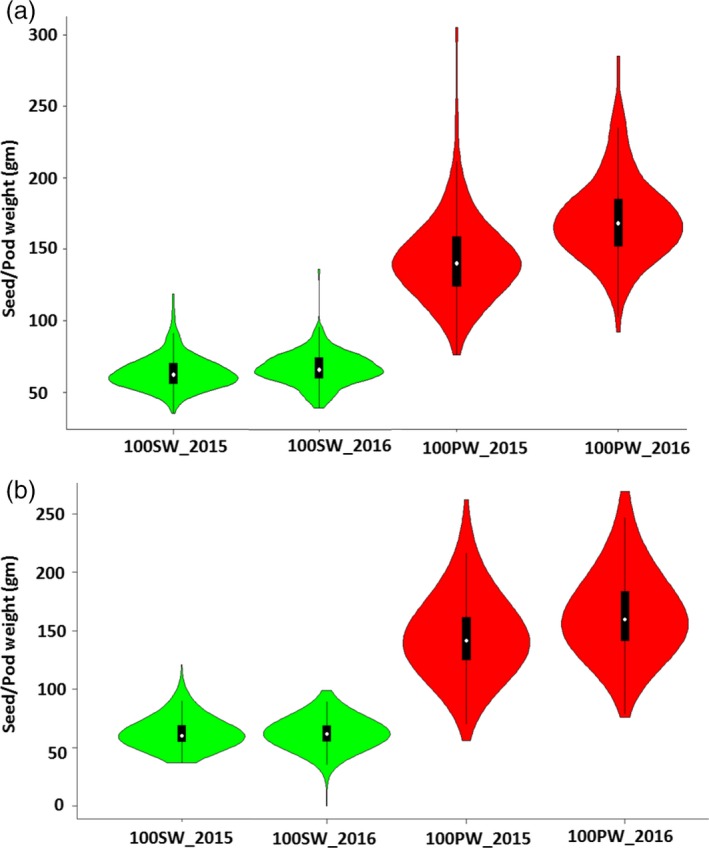
Violin plots represent the variation available in phenotypic data for pod weight and seed weight in nested‐association mapping (NAM) populations. (a) NAM_Tifrunner and (b) NAM_Florida‐07 during season 2015 and 2016.
Official websites use .gov
A
.gov website belongs to an official
government organization in the United States.
Secure .gov websites use HTTPS
A lock (
) or https:// means you've safely
connected to the .gov website. Share sensitive
information only on official, secure websites.
Violin plots represent the variation available in phenotypic data for pod weight and seed weight in nested‐association mapping (NAM) populations. (a) NAM_Tifrunner and (b) NAM_Florida‐07 during season 2015 and 2016.