
Figure 3.
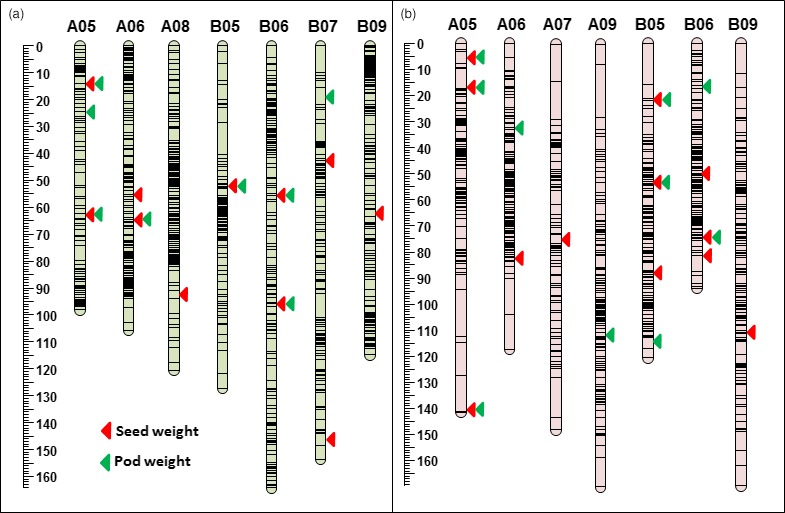
Genomic regions (QTLs) identified for pod weight (PW) and seed weight (SW) in linkage analysis. (a) QTLs identified for pod weight and seed weight using NAM_Tifrunner population. (b) QTLs identified for pod weight and seed weight using NAM_Florida‐07 population. Red triangles for SW and green triangles for PW.