
Figure 4.
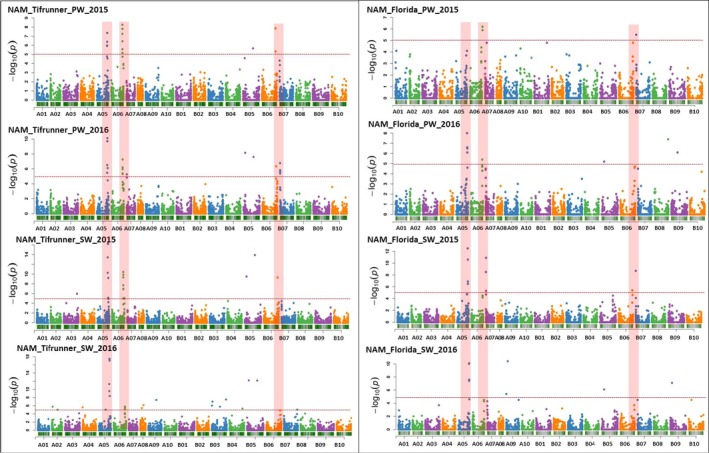
SNP–Trait Associations (STAs) for pod weight (PW) and seed weight (SW) identified using genomewide association study in NAM_Tifrunner and NAM_Florida‐07 populations. Manhattan plots represent the associations for PW and SW. For the NAM‐T, four plots are for PW and SW in two seasons for the years 2015 and 2016. Indicated as NAM_Tifrunner_PW_2015, NAM_Tifrunner_PW_2016, NAM_Tifrunner_SW_2015, NAM_Tifrunner_SW_2016. Similarly, for the NAM‐F, four plots were constructed for PW and SW for two season data during the year 2015 and 2016. Indicated as NAM_Florida_PW_2015, NAM_Florida_PW_2016, NAM‐Florida_SW_2015 and NAM_Florida_SW_2016. The SNPs on chromosomes A05, A06, B06 and B07 highlighted with red colour indicate consistently high association with PW and SW across the seasons.