
Figure 5.
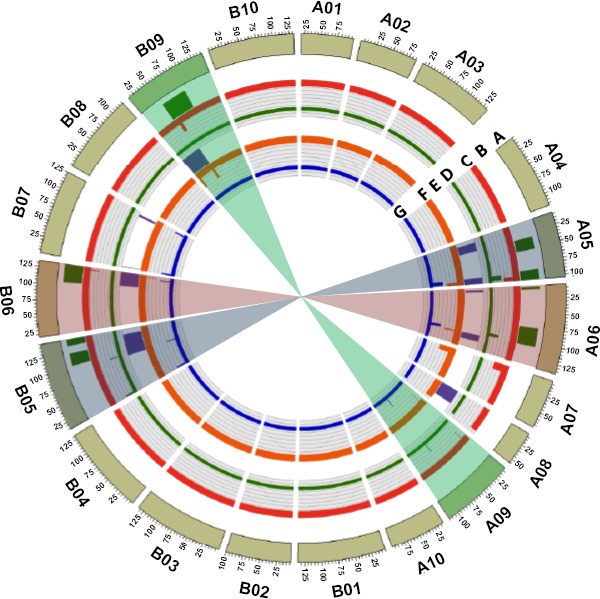
Circos plot represents summary of genomic regions identified in genomewide association study and genetic mapping for pod weight and seed weight in NAM_Tifrunner and NAM_Florida‐07 populations. (a) peanut pseudomolecules from A subgenome are depicted as A01 to A10 and that of B subgenome depicted as B01 to B10; (b) QTLs identified for pod weight and seed weight in NAM_Florida‐07; (c) STAs identified for seed weight in NAM_Florida‐07; (d) STAs identified for pod weight in NAM_Florida‐07; (e) QTLs identified for pod weight and seed weight in NAM_Tifrunner population; (f) STAs identified for seed weight in NAM_Tifrunner; (g) STAs identified for pod weight in NAM_Tifrunner. STAs overlapping in QTL regions were identified on chromosome A05, A06, B05, B06 and B09.