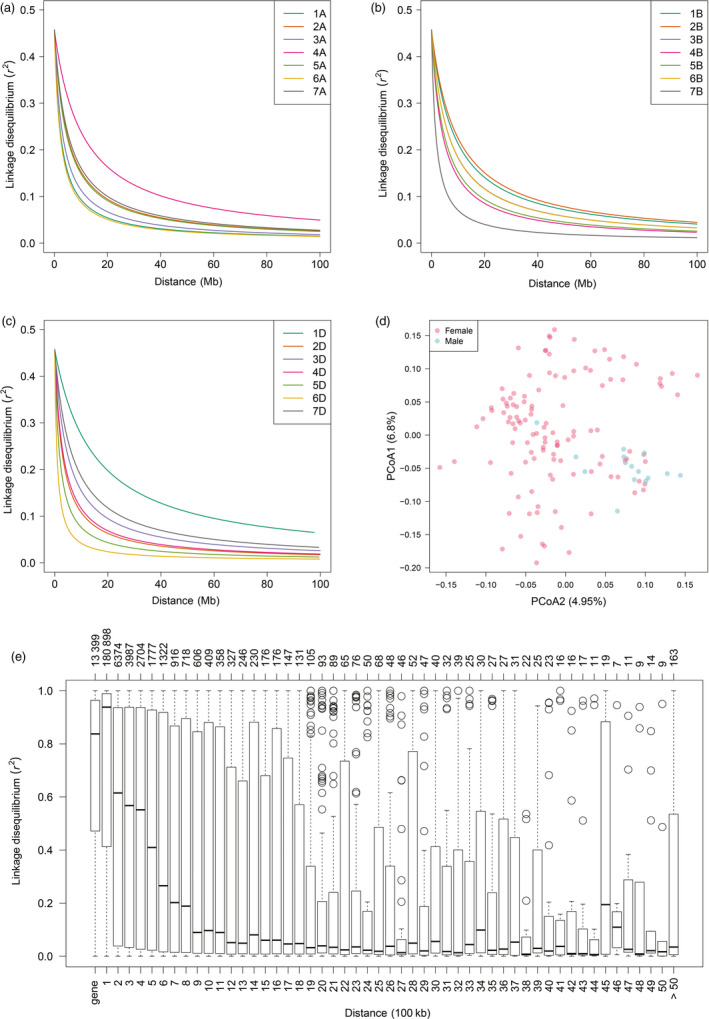
Figure 1.

Linkage disequilibrium decay and diversity analysis in a wheat population composed by 1574 hybrids plus their 118 female and 15 male parent lines. Linkage disequilibrium (LD, as r 2) decay plots as a function of physical distance (Mb) within each chromosome for subgenomes A (a), B (b) and D (c). (d) Diversity among the 133 parent lines of the studied hybrid wheat population portrayed in a biplot of the first two principal coordinates from a principal coordinate analysis on the pairwise Rogers’ distance matrix calculated using exome capture single‐nucleotide polymorphisms (SNPs) profiles. (e) Boxplot charts showing the distributions of average LD within a gene and of LD between adjacent SNPs. Bins in the lower x‐axis correspond to the region defined by a gene or to regions defined by adjacent SNPs separated by certain physical distance (100 Kb). The upper x‐axis shows the number of SNP pairs belonging to each corresponding bin in the lower x‐axis.
