Figure 3.

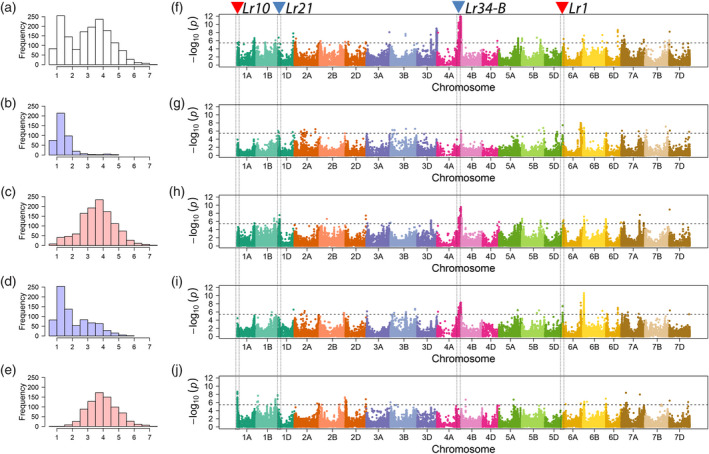
Genome‐wide exome association scans for additive effects underlying leaf rust severity in a hybrid wheat population and its different subpopulations. Left panel: Histogram of leaf rust severity in: (a) a hybrid wheat population of 1574 hybrids plus their 118 female and 15 male parent lines and its subpopulations (b) Top25%, (c) Inferior75%, (d) Top50% and (e) Inferior50%. Right panel: Manhattan plots of genome‐wide exome association scans for additive effects underlying leaf rust severity in: (f) total population, (g) subpopulation Top25%, (h) Inferior75%, (i) Top50% and (j) Inferior50%. –log10(P‐value)s of the significance test are plotted against physical positions on chromosome. Black horizontal dashed lines indicate the genome‐wide multiple test corrected significance threshold for association analysis. The candidate region of Lr10, Lr21, Lr1 and Lr34‐B homologous gene of Lr34 is marked with vertical dashed lines and triangles. Blue triangles mean that these loci were detected in total population and subpopulations, while red triangles mean those are only significant in subpopulations.
