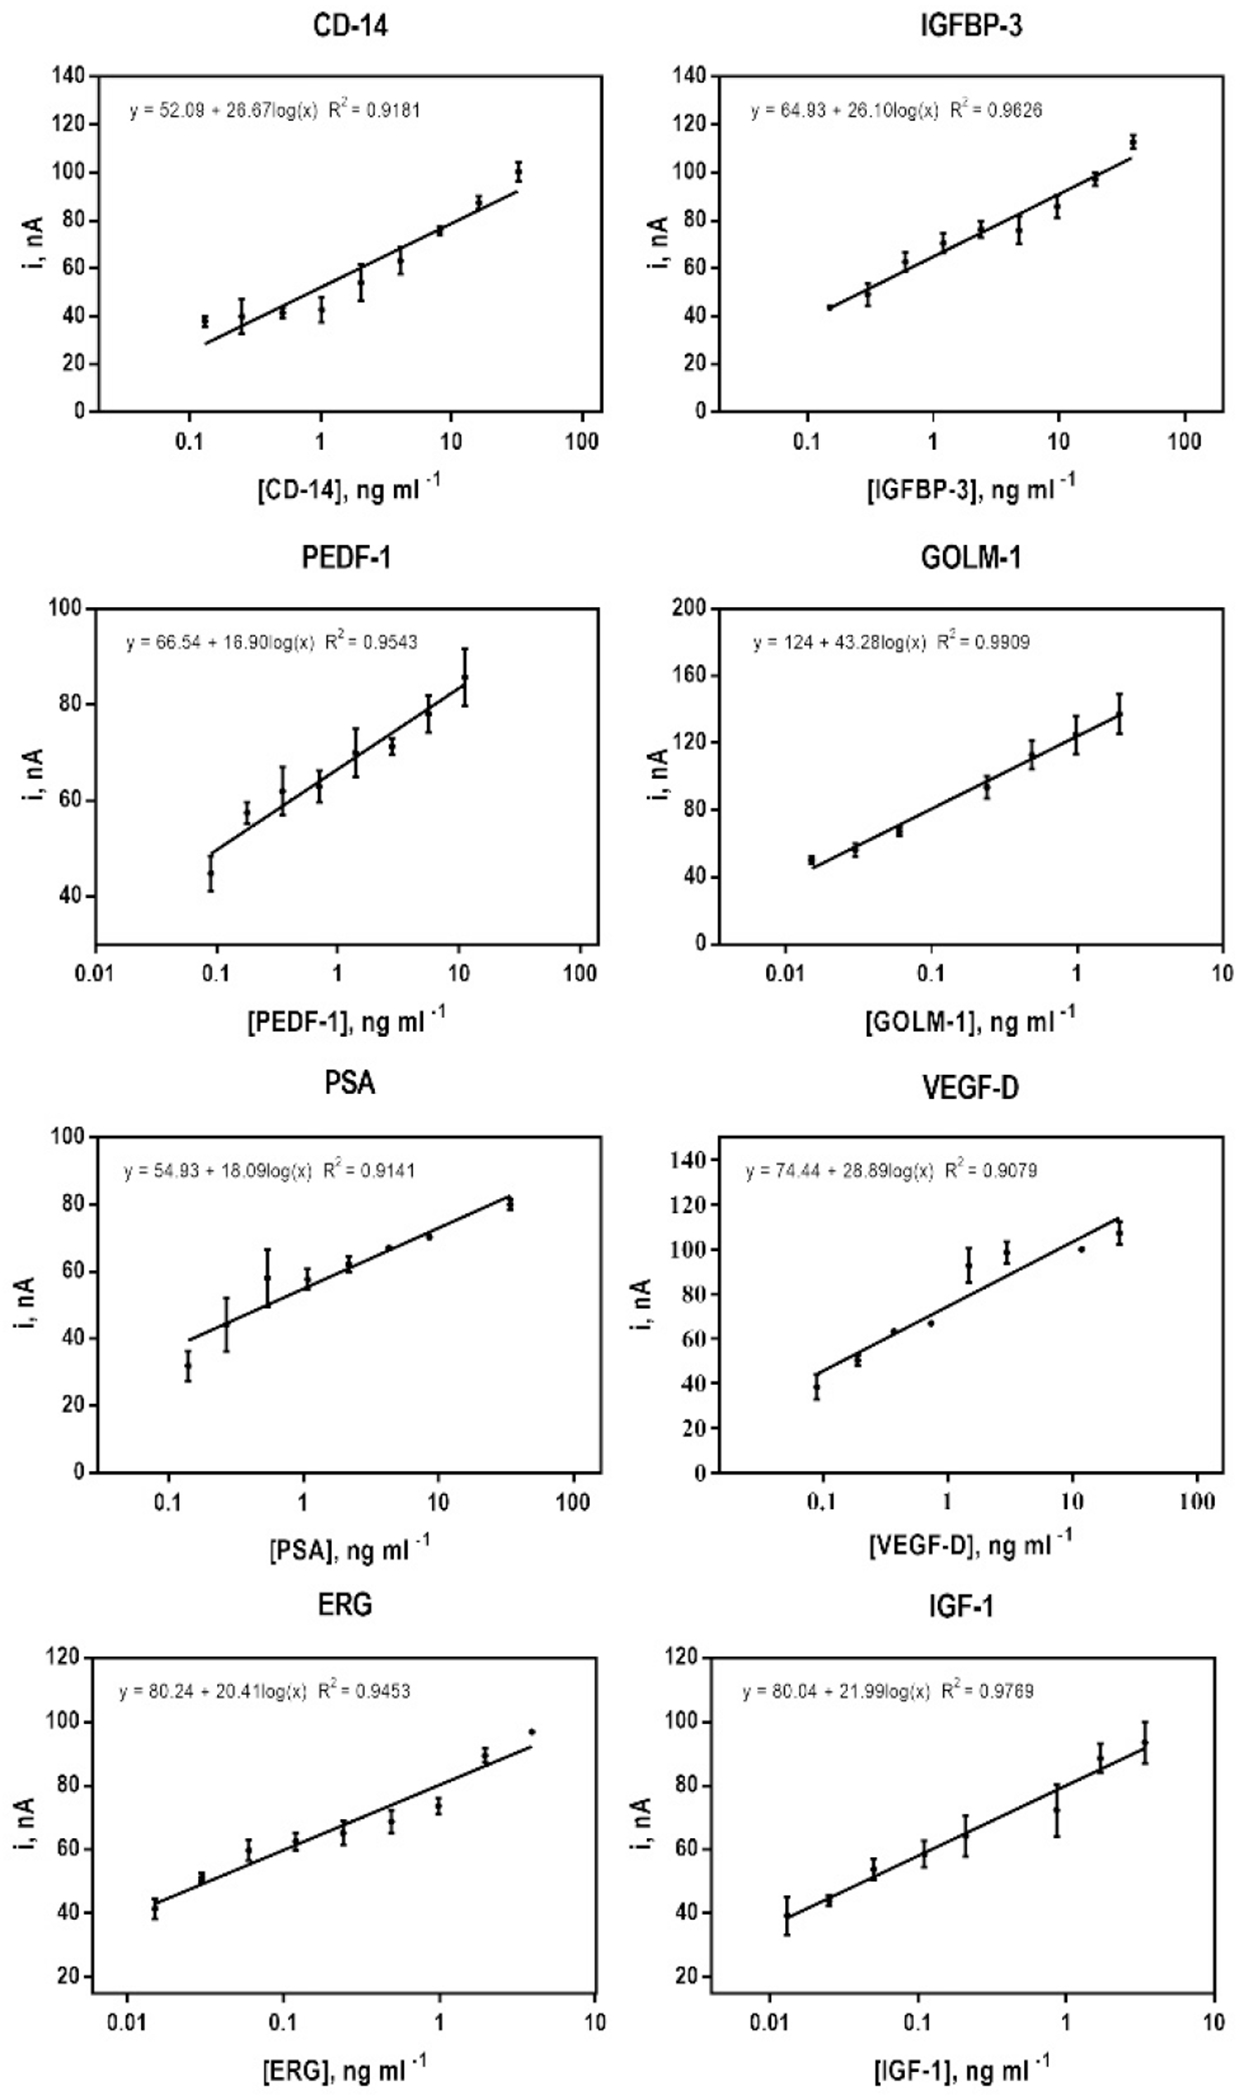
Fig. 2.

Immunoarray calibration plots using amperometric responses for PSA, VEGF, ERG, IGF-I, IGFBP-3, CD-14, PEDF and GOLM-1 at −0.2 V vs Ag/AgCl developed by injecting 1 mM HQ and 0.1 mM H2O2 after capturing analyte Ab2-HRP-MB-Ag bioconjugates on modified carbon electrode surfaces contained within the microfluidic device detection chambers. Protein standards were diluted 5X in calf serum, to mimic a complex sample matrix. Error bars represent the range (n=2) for the two electrodes in each immunoarray designed to detect the protein.
