
Figure EV1. Serum antibody responses against the AAV vector capsid and PR8‐specific IgA.
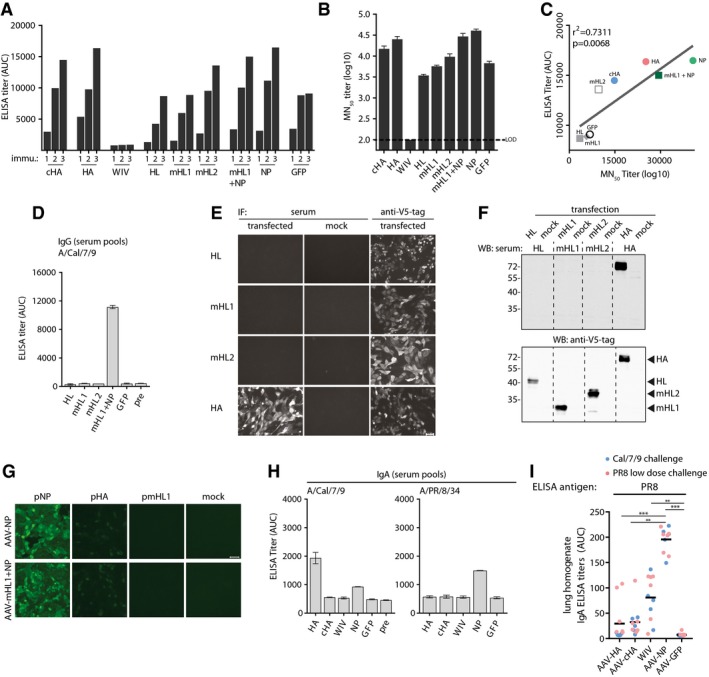
- Total IgG ELISA titer induction over vaccination period against AAV9‐vector capsids in pooled sera (AAV‐HA, ‐cHA, ‐GFP, WIV n = 18; AAV‐NP n = 11; AAV‐HL, ‐mHL1, ‐mHL2 n = 7 mice per group) at indicated time points.
- AAV9‐vector‐neutralizing antibody titers in pooled pre‐challenge sera (AAV‐HA, ‐cHA, ‐GFP, WIV n = 18; AAV‐NP n = 11; AAV‐HL, ‐mHL1, ‐mHL2 n = 7 mice per group, technical duplicates). Dotted line indicates the limit of detection (LOD) at a dilution of 1:100. Mean ± SD.
- Regression analysis of total AAV9‐vector IgG ELISA titers and MN50 titers. Coefficient of correlation (r 2) and P‐value are shown.
- Total IgG ELISA titers expressed as AUC against homologous Cal/7/9 virus in pre‐challenge serum pools (AAV‐HA, ‐cHA, ‐GFP, WIV n = 18; AAV‐NP n = 11; AAV‐HL, ‐mHL1, ‐mHL2 n = 7 mice per group, technical duplicates) of the indicated vaccine groups. Mean ± SD.
- Immunofluorescence microscopy staining of MDCKII cells 48 h after transfection with pAAV plasmids expressing the indicated constructs. Cells were fixed, permeabilized, and stained with the indicated mouse pre‐challenge serum pools or with anti‐V5‐tag antibody groups (n = 2, technical duplicates) (bar, 50 μm).
- Immunoblot analysis with lysates obtained from 293T 48 h after transfection with pAAV plasmids expressing the indicated constructs. Immunoblot was performed with the indicated pre‐challenge mouse serum pools (top, AAV‐HA n = 18, AAV‐HL, ‐mHL1, ‐mHL2 n = 7 mice per group). Hereafter, membranes were stripped and stained with anti‐V5‐tag antibody (bottom). Position of detected protein bands is indicated to the right (bottom).
- Immunofluorescence microscopy staining of MCDKII cells 24 h after transfection with wild‐type Cal/7/9 NP or HA and mHL1 plasmids with pre‐challenge serum from AAV‐NP or AAV‐mHL1 + NP immunization groups (n = 2, technical duplicates) (bar, 50 μm).
- IgA ELISA titers against Cal/7/9 or PR8 virus in pooled pre‐challenge sera (AAV‐HA, ‐cHA, ‐GFP, WIV n = 18; AAV‐NP n = 11 mice per group, technical duplicates). Mean ± SD.
- IgA ELISA titers in post‐challenge lung homogenates of individual mice of the Cal/7/9 and PR8 low‐dose challenge groups of the indicated vaccine groups against PR8. Statistical significance between vaccine groups was determined using Kruskal–Wallis test with Dunn's multiple comparison testing (**P < 0.01, ***P < 0.001). Lines indicate mean. ELISAs were done in technical duplicates.
Source data are available online for this figure.