-
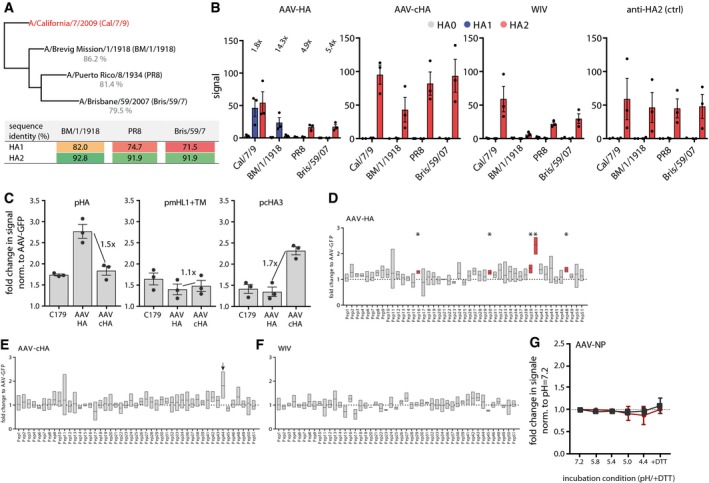
A
Phylogenetic tree of the complete HA sequences of the four H1N1 viruses used for immunoblot analysis with mouse serum. The table shows the amino acid identities of the H1N1 viruses HA1 or HA2 subdomain compared to Cal/7/9 HA1 and HA2, respectively, as determined with Geneious 11.1.5 software.
-
B
Quantification of immunoblot data as shown in Fig
3A. Intensities of bands were analyzed using ImageJ. Dots indicate individual experiments, bars mean ± SE (
n = 3). Numbers in the AAV‐HA panel indicate fold‐change of signal of the HA2 band of the AAV‐HA compared to the AAV‐cHA group.
-
C
In‐cell ELISA with transfected MDCKII cells expressing either Cal/7/9 full‐length HA (pAAV‐HA), the HA‐stalk (pAAV‐mHL1 + transmembrane region), or chimeric HA consisting of the Cal/7/9 HA stalk and the H13 HA head (pcHA3). Detection of the HA constructs was done with indicated mouse serum at a 1:250 dilution or with the conformational stalk antibody C179. Dots indicate individual experiments, bars mean ± SE (n = 3, technical triplicates). Numbers indicated the fold‐change of signal between AAV‐HA and AAV‐cHA groups tested against the indicated HA construct.
-
D
Results of 15‐mer Cal/7/9 peptide screen with AAV‐HA pooled pre‐challenge serum (n = 18 mice). Peptides were coated in 96‐well plates, incubated with serum before binding was detected with a HRP‐coupled secondary antibody. Data are shown as fold induction over AAV‐GFP signal intensity (n = 3, technical duplicates). Statistical significance between each peptide signal and the baseline value 1 (dotted line) was determined using one‐sample t‐test (*P < 0.05). Floating bars represent mean ± range.
-
E, F
Results of epitope screen with 15‐mer peptides with pooled AAV‐cHA and WIV sera (n = 18 mice per group). For AAV‐cHA, peptide #44, showing increased but non‐significant binding, is indicated by an arrow. Statistical significance between each peptide signal and the baseline value 1 (dotted line) was determined using one‐sample t‐test. Floating bars represent mean ± range (n = 3, technical duplicates).
-
G
Binding of AAV‐NP pre‐challenge sera (n = 11 mice) to Cal/7/9 or PR8 virus after incubation of the virions at pH = 7.2, 5.8, 5.4, 5.0, 4.4 or 4.4 + DTT. Bars represent mean ± SD (n = 3).