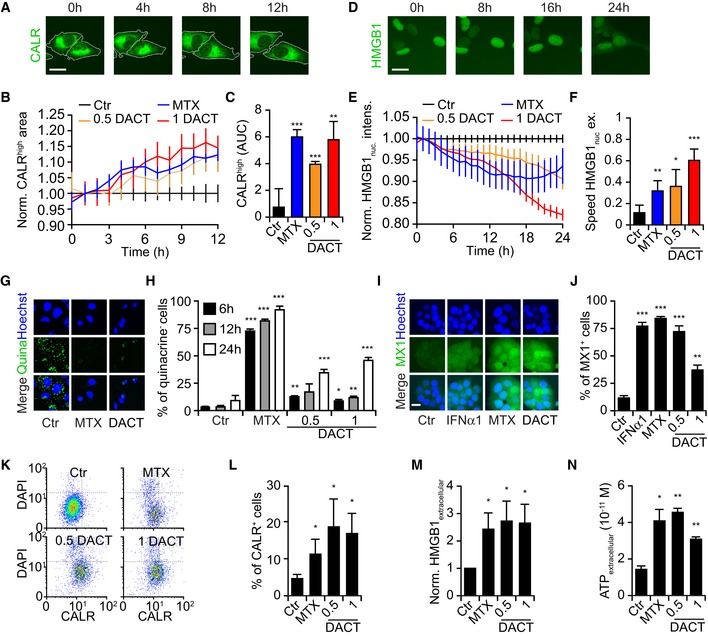
Human osteosarcoma U2OS cells were treated with dactinomycin (DACT) at 0.5 or 1 μM, or with mitoxantrone (MTX) between 1 and 6 μM as positive control (A‐N).
-
A–C
Human osteosarcoma U2OS cells stably expressing CALR‐GFP and H2B‐RFP were treated as described above, and images were acquired once per hour for 12 h (A). For one representative experiment among three, the mean ± SEM of the average area of high CALR dots (normalized to the control at each time point) of quadruplicates is shown (B). Values are depicted as the area under the curve mean ± SD of triplicates (C).
-
D–F
Treated U2OS cells stably expressing HMGB1‐GFP and H2B‐RFP images were acquired every hour for 24 h (D). For one representative experiment among three, the mean ± SEM of the green fluorescence intensity in the nucleus (normalized to the control at each time point) of quadruplicates is depicted (E). For each cell, the speed of nuclear release (difference of HMGB1 nuclear green fluorescence intensity between two time points) was calculated. Values are depicted as the average speed of the nuclear release mean ± SD of quadruplicates (F).
-
G, H
U2OS cells were treated for 6, 12, or 24 h, and ATP was stained with quinacrine (G). The number of quinacrine negative cells was assessed based on the distribution of cellular green fluorescence intensity in MTX versus control conditions. For one representative experiment among three, the mean ± SD of quadruplicate assessments is shown (H).
-
I, J
U2OS wild‐type cells were treated with MTX or DACT as described above for 6 h. Then, medium was refreshed and 24 h later, type I interferon response was assessed by transferring the supernatant on HT29 MX1‐GFP reporter cells lines cells for additional 48 h. Human type 1α interferon (IFNα1) was also added on the cells as an additional positive control. Images were acquired by fluorescence microscopy, and the number of positive cells was assessed based on the distribution of cellular green fluorescence intensity in IFNα1 versus control conditions (I). The percentage of MX1‐positive cells was calculated, and the mean ± SEM of five independent experiments is depicted (J).
-
K, L
U2OS wild‐type cells were treated as mentioned above for 6 h, and then, medium was refreshed. Twenty‐four hours later, cells were collected and surface‐exposed calreticulin (CALR) was stained with an antibody specific for CALR. DAPI was used as an exclusion dye, and cells were acquired by flow cytometry (K). The percentage of CALR+ cells among viable (DAPI−) ones is depicted. The mean ± SEM of six independent experiments is depicted (L).
-
M
U2OS cells were treated as described above for 24 h, and the concentration of HMGB1 released in the supernatant was quantified with an ELISA kit and then normalized to control. The mean ± SEM of four independent experiments is shown.
-
N
U2OS were treated as described above for 24 h. Concentration of secreted ATP in the supernatant was quantified with a luciferase‐based bioluminescence kit. The mean ± SD of quadruplicates from one representative among three experiments is depicted.
Data information: Scale bars represent 20 μm. All
‐values showing significances of treatments compared to control (Ctr) were calculated with Student's
< 0.001.

