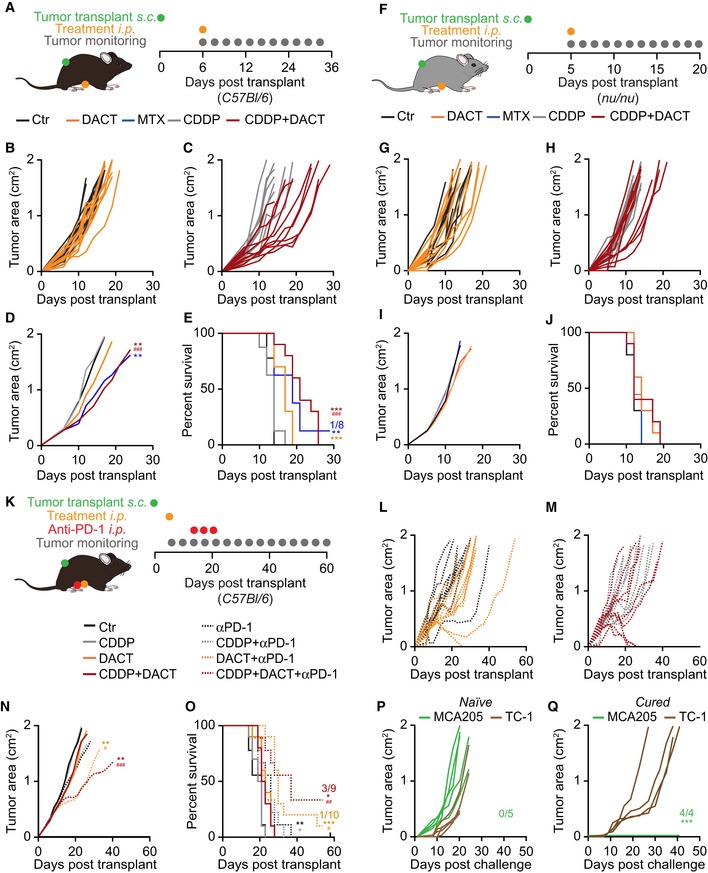
A–J3 × 105 mouse fibrosarcoma MCA205 cells were injected subcutaneously (s.c) into the flank of immunocompetent syngeneic C57Bl/6 mice with n mice per group (n = 8 for MTX and CDDP, n = 9 for Ctr, or n = 10 for DACT and CDDP + DACT) (A‐E) or athymic immunodeficient nu/nu mice (n = 9 for CDDP and n = 10 for other groups) (F‐J). When tumors became palpable, the mice were treated intraperitoneally (i.p.) with injectable solution (Ctr), 5.17 mg/kg mitoxantrone (MTX), 0.5 mg/kg cisplatin (CDDP), 0.5 mg/kg dactinomycin (DACT), or the combination of CDDP + DACT. Tumor size was assessed regularly, and tumor growth of DACT versus controls Ctr (B, G) and DACT + CDDP versus CDDP alone (C, H) is depicted. Mean tumor area for each group was calculated, and significances were tested using a type II ANOVA test (D, I). Overall survival is depicted, and P‐values were calculated with a log‐rank test (E, J). Stars indicate the P‐value of each treatment versus Ctr control, and hashes indicate P‐values of the combination treatment versus CDDP alone (**/##
P < 0.01, ***/###
P < 0.001) (D, E).
K–Q1 × 105 MCA205 cells were injected subcutaneously (s.c.) into the flank of immunocompetent syngeneic C57Bl/6 mice (n = 9 for Ctr, Ctr + anti‐PD‐1, CDDP + anti‐PD‐1, and CDDP + DACT + anti‐PD‐1; n = 10 for CDDP, DACT, DACT + anti‐PD‐1, CDDP + DACT) (K). When tumors became palpable, mice were treated intraperitoneally (i.p) with injectable solution, 0.5 mg/kg CDDP, 0.5 mg/kg DACT, or the combination of CDDP + DACT. At days 6, 10, and 14 after chemotherapy, mice were treated i.p. with 100 μg anti‐PD‐1 per mouse or a corresponding isotype. Tumor size was assessed regularly, and tumor growth of DACT + PD‐1 versus PD‐1 alone (L) and DACT + CDDP + PD‐1 versus CDDP + PD‐1 (M) is shown. Mean tumor area for each group was calculated, and significances were determined using a type II ANOVA test. (N). Overall survival is depicted, and P‐values were calculated with a log‐rank test (O). * indicates the P‐value of DACT + anti‐PD‐1 or CDDP + DACT + anti‐PD‐1 versus the respective conditions without anti‐PD‐1; # indicates the P‐values of DACT + anti‐PD‐1 or CDDP + DACT+anti‐PD‐1 compared to the respective conditions without DACT (*/#
P < 0.05, **/##
P < 0.01, ***/###
P < 0.001) (N, O). The four surviving mice from this experiment were rechallenged with MCA205 and TC‐1 cells injected in opposite flanks. Five naïve mice were co‐injected as controls. Individual growth curves of both MCA205 and TC‐1 tumors are depicted for cured (P) and naïve mice (Q). The tumor area formed by MCA205 growth in cured mice was compared to the one in naïve mice was calculated using a type II ANOVA test (***P < 0.001) (Q).

