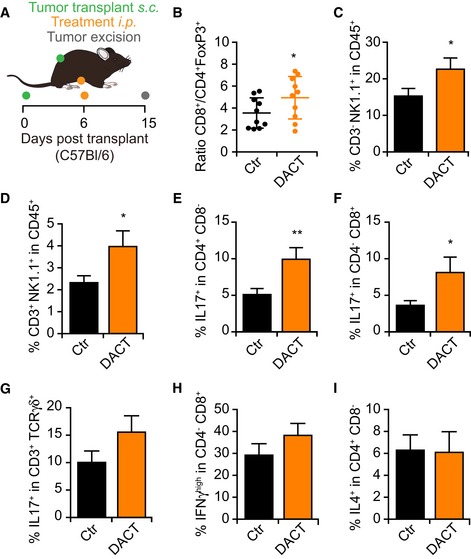
A–I2 × 105 mouse fibrosarcoma MCA205 cells were injected subcutaneously (s.c) into the flank of immunocompetent syngeneic C57Bl/6 mice (n = 10 per group). When tumors became palpable, injectable solution (Ctr) or 0.5 mg/kg dactinomycin (DACT) was administered intraperitoneally (i.p.). Nine days after chemotherapy, the mice were sacrificed, and the tumors were collected and processed (A). 50 mg of tumor was used for each antibody panel, the “T‐cell panel” with n = 10 mice per group and the “NK cells and cytokines panel” with n = 9 mice for Ctr group and n = 8 mice for DACT group. The “T‐cell panel” included staining of CD4, CD8a, and FoxP3 receptors. A dot plot with means ± SD showing the ratio of the number of CD3+CD8a+ cells versus the number CD3+CD4+FoxP3+ cells in each tumor is depicted with each dot corresponding to one mouse (B). The “NK cells and cytokines panel” included CD45, CD3g,d,e, CD8a, CD4, NK1.1, TCRγ(, IL17a, IFNγ, and IL4. The mean ± SEM of the percentage of CD3g,d,e−NK1.1+ (C) and CD3g,d,e+NK1.1+ cells (D) among all CD45+ cells is depicted. The mean ± SEM of the percentage of IL17a+‐positive cells among the CD3g,d,e+CD4+CD8a− T cells (E), among CD3g,d,e+CD4−CD8a+ T cells (F), and among CD3g,d,e+TCRγ(+ is shown (G). The mean ± SEM of the percentage of IFNγhigh cells among CD3g,d,e+CD4−CD8a+ T cells (H) and of IL4+ cells among CD3g,d,e+CD4+CD8a− T cells (I) is depicted. P‐values of the statistical difference to the Ctr group were calculated using Student's t‐test: *P < 0.05, **P < 0.01 (B–I).

