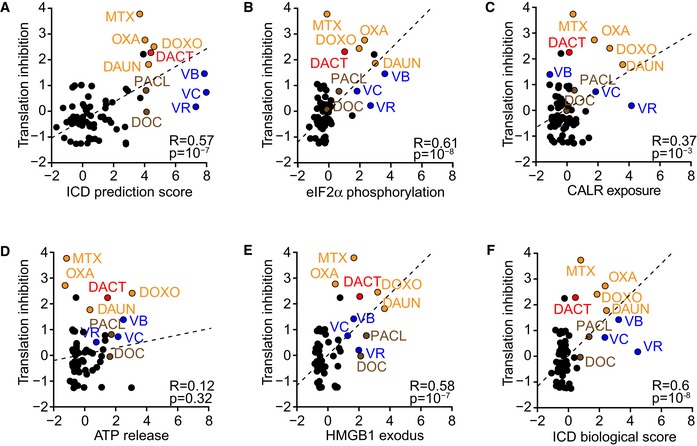
U2OS wild‐type cells were pre‐treated for 12 h with a custom‐made anticancer library as previously described (Bezu
et al,
2018) at 3 μM followed by 30‐min treatment in methionine‐free medium, before addition of azidohomoalanine (AHA). The percentages of inhibition of translation were transformed as z‐scores. The correlations between translation inhibition and ICD prediction score (A), peIF2α expression (B), CALR exposure (C), ATP decrease (D), HMBG1 decrease (E), and biological calculated ICD score (F) previously measured and also expressed as z‐scores (Bezu
et al,
2018) were compared by means of the Pearson method resulting in a correlation coefficient (R) and corresponding
P‐value (
P). Known immunogenic drugs are highlighted in color: dactinomycin (DACT), mitoxantrone (MTX), doxorubicin (DOXO), daunorubicin (DAUN), oxaliplatin (OXA), docetaxel (DOC), paclitaxel (PACL), vinblastine (VB), vincristine (VC), and vinorelbine (VR).

