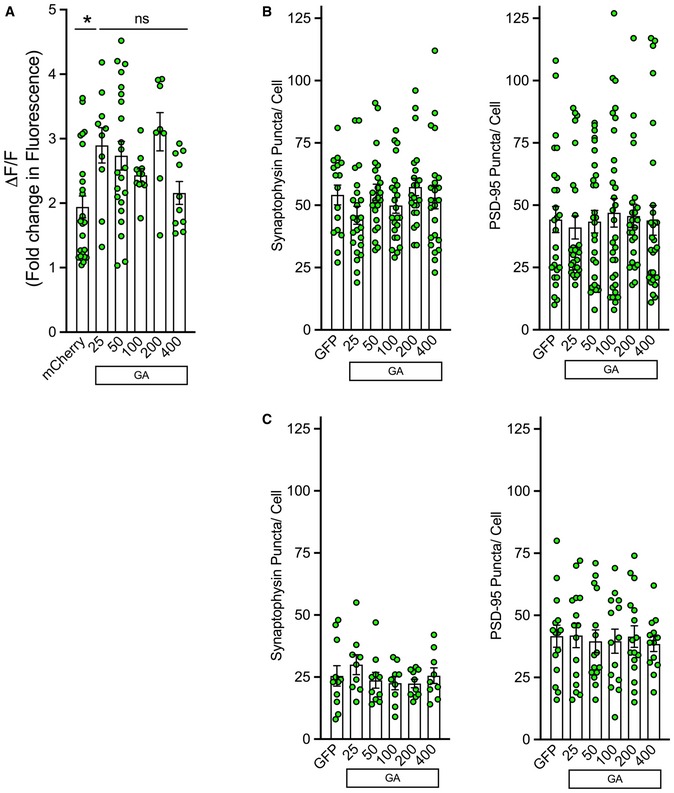
Figure EV3. Synaptophysin and PSD‐95 remain unaltered in neurons containing GA aggregates.

-
APrimary cortical neurons were co‐transfected with mCherry or mCherry‐GAn and GCaMP6f. After 48 h, mCherry‐positive cells were determined. Green fluorescence intensity was then recorded from identified neurons. Basal fluorescence was monitored prior to induced depolarization via perfusion with ACSF containing 50 mM KCl. Graphical representation is the quantification of peak change in fluorescence (ΔF) following ACSF perfusion normalized to basal fluorescence (F), ΔF/F. A significant increase was observed in mCherry‐GAn containing cells (GA25, GA50, GA200) (*P < 0.05); however, a length‐dependent association with Ca2+ influx levels was not detected. Data presented as mean ± SEM. One‐way ANOVA, post hoc Dunnett's multiple comparison test. A total of 8–25 cells per condition were pooled from n = 5 independent biological replicates.
-
B, CeGFP‐GAn dipeptides were expressed in cortical or motor neurons for 48 h and then immunostained for neurofilament and either synaptophysin or PSD‐95. Z‐stack confocal images were captured at 60× magnification; puncta were quantified by ImageJ through manual counting. (B) Quantification of synaptophysin (left) or PSD‐95 (right) puncta along neurites in eGFP‐GAn expressing cortical neurons compared with eGFP‐only expressing cells revealed no significant differences. (C) Quantification of synaptophysin (left) or PSD‐95 (right) puncta along neurites in eGFP‐GAn expressing motor neurons compared with eGFP‐only expressing cells revealed no significant differences. Data presented as mean ± SEM. One‐way ANOVA, post hoc Dunnett's multiple comparison test, 15–20 cells derived from n = 3 independent biological replicates.
