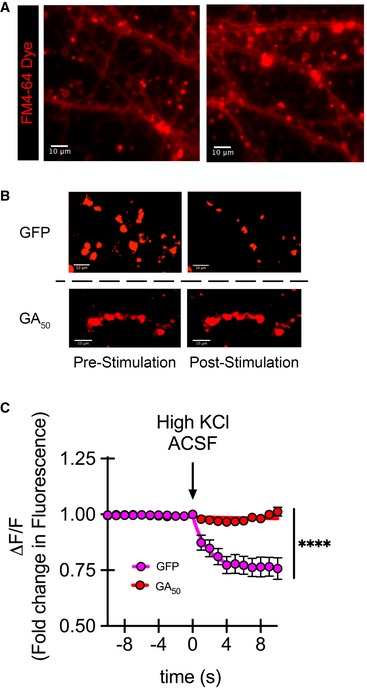
Figure 4. GA aggregates significantly impair synaptic unloading.

-
ARepresentative dye loading showing defined puncta regions along neurites 40× magnification, scale bar indicates 10 μm.
-
BRepresentative intensities of FM4‐64 puncta regions pre‐ and post‐stimulation demonstrate loss of synaptic puncta fluorescence intensity following stimulation in eGFP but not GA50 containing neurons. These images visually reflect the process performed in an automated manner through our imaging software to determine puncta fluorescence intensity. An unbiased constant threshold is placed on each image per experiment; then fluorescence intensity is measured over time. The threshold applied isolates puncta from background, giving distinct regions. 8‐bit images were thresholded and pseudo‐color (red) was applied to enlarged puncta regions of interest, scale bar indicates 10 μm.
-
CGraphical representation is the change in fluorescence (ΔF) normalized to basal fluorescence (F), ΔF/F. The final 10 s of baseline recording and 10 s of the depolarization phase are shown; arrow indicates start of depolarization. Non‐linear regression was performed in GraphPad Prism7 using the plateau followed by one‐phase decay model. The decay constant (k) for eGFP was 0.4971 s−1, while for GA50, it was 219.5 s−1. Similarly, the tau (τ) values were 2.012 s for eGFP and 0.00455 s for GA50, respectively. Data presented as mean ± SEM for each imaged timepoint. Statistical significance was determined using the Sidak–Bonferroni method, ****P < 0.0001, n = 20 puncta regions from four biological replicates. Exact P‐values can be found in Appendix Table S1.
