-
A
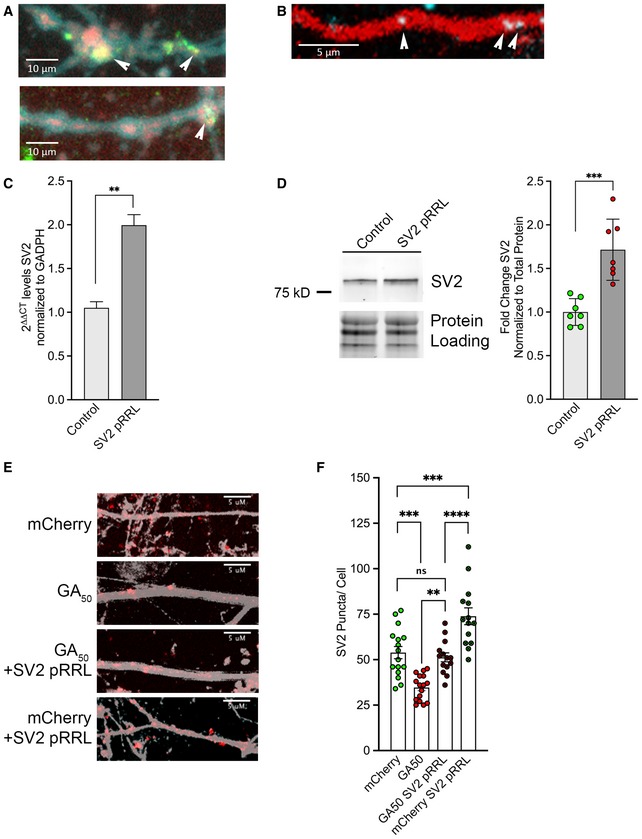
mCherry‐GAn dipeptides were expressed in cortical or motor neurons for 48 h and then immunostained for SV2 and a neuritic marker for neurofilament (SMI‐32). Representative z‐stack confocal images of neurites (SMI‐32, cyan), showing colocalization of mCherry‐GA50 aggregates (red) with SV2 puncta (green). Arrows highlight colocalized areas; scale bars indicate 10 μm.
-
B
A custom beacon probe was generated against SV2 mRNA, which was co‐transfected along with eGFP or eGFP‐GA50 constructs and the cell‐filling td‐Tomato plasmid into mature cortical neurons. Shown is a representative image of this mRNA beacon (blue) localized to td‐Tomato positive neurites (red). Arrows highlight colocalized areas; scale bar indicates 5 μm.
-
C
mRNA was Trizol extracted from three independent wells of rSV2a‐eGFP‐pRRL lentiviral‐transduced wells of cortical neurons and non‐transduced controls following 4 days of transduction. RNA was converted to cDNA using the Superscript First‐strand kit, and qPCR was performed using PowerUp SYBR Green. Measurements were normalized to the housekeeping gene GAPDH and then to non‐transduced controls. Analysis was performed using the ΔΔCT method. 2ΔΔCT ± SE is presented. Quantification revealed a 1.99‐fold increase in SV2 mRNA. Unpaired t‐test, **P < 0.01, n = 3 biological replicates.
-
D
Whole‐cell lysates were generated from three independent wells of rSV2a‐eGFP‐pRRL lentiviral‐transduced wells of cortical neurons and non‐transduced controls following 4 days of transduction. Lysates were immunoblotted for SV2 and normalized to total protein loading. Quantification band intensities revealed a significant upregulation of SV2 protein levels in rSV2a‐eGFP‐pRRL‐transduced neurons. Data presented as mean ± SEM. Unpaired t‐test, ***P < 0.001, n = 3 independent biological replicates.
-
E, F
eGFP‐GA50 dipeptides were expressed in primary cortical neurons for 48 h with or without the addition of SV2 pRRL lentivirus. Cells were immunostained for neurofilament (gray) and SV2 (red). (E) Representative z‐stack confocal images of neurites from mCherry, mCherry‐GA50, mCherry‐GA50, +SV2 pRRL, and mCherry + SV2 pRRL‐expressing cortical neurons. 60× magnification, scale bar indicates 5 μm. (F) Quantification of SV2 puncta along neurites by ImageJ manual counting. The significant reduction in SV2 puncta upon GA50 expression was significantly rescued to normal levels by exogenous expression through transduction with the SV2 pRRL lentiviral vector. Data presented as mean ± SEM. One‐way ANOVA, post hoc Dunnett's multiple comparison test, **P < 0.05, ***P < 0.001, ****P < 0.0001, m = 5 neurons per condition from n = 3 independent biological replicates.
.

