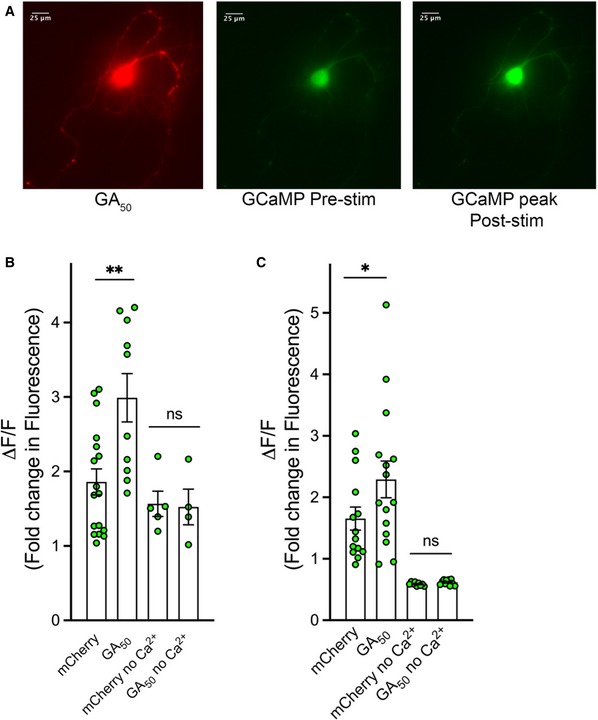
Primary cortical or motor neurons were co‐transfected with mCherry or mCherry‐GA
50 and GCaMP6f. After 48 h, mCherry‐positive cells were determined. Green fluorescence intensity was then recorded from identified neurons. Basal fluorescence was monitored prior to induced depolarization via perfusion with ACSF containing 50 mM KCl.
-
A
Representative images of a co‐transfected cortical neuron expressing mCherry‐GA50 (left panel) and GCaMP6f (right two panels). This image shows a representative demonstration of the increase in detectable green fluorescence from the GCaMP6f indicator pre‐ and post‐stimulation (center and right, respectively). 40× magnification, scale bar indicates 25 μm.
-
B, C
Graphical representation of the peak change in fluorescence (ΔF) following ACSF perfusion normalized to basal fluorescence (F), ΔF/F. The contribution of Ca2+ influx was determined by experiments in which stimulation was performed in ACSF containing high KCl but no Ca2+. Quantification of the peak change in fluorescence in cortical neurons (B) and motor neurons (C).
Data information: Data presented as mean ± SEM. One‐way ANOVA with uncorrected Fisher's LSD test, *
P < 0.05, **
P < 0.01. A total of 20 cells per condition were pooled from eight independent experiments. Exact
P‐values can be found in
Appendix Table S1.

