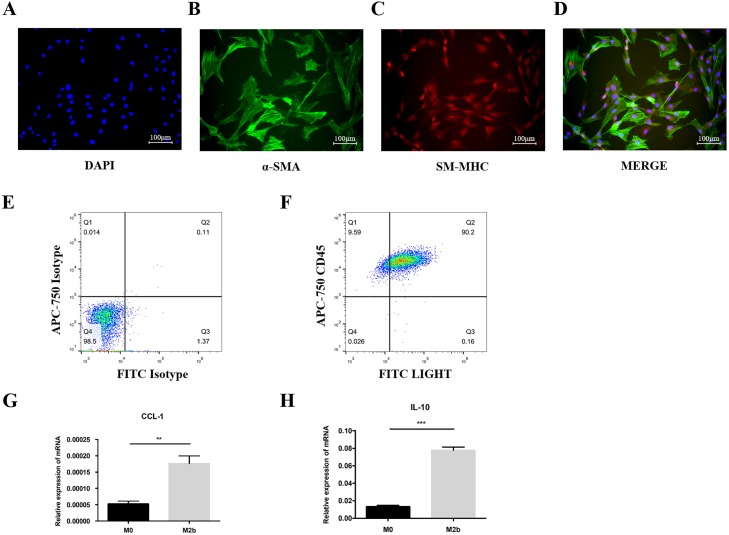
Figure 1. Identification of PASMCs from monocrotaline-induced pulmonary artery hypertension rats and M2b macrophages.
(A–D) Immunofluorescence experiments for co-staining of α-SMA and SM-MHC. Quantitative results showed that 94.52 ± 1.76% of cells co-expressed α-SMA and SM-MHC (n = 3). (E, F) M2b macrophages were stained to assess LIGHT and CD45 expression and were analyzed by flow cytometry. Over 90% of the cells were LIGHT+ CD45+ (n = 3). (G, H) The mRNA levels of CCL-1 and IL-10 were detected by qRT-PCR in macrophages. Data are shown as the mean ± SEM (n = 3 for each group). **p < 0.01, ***p < 0.001. “M0” indicates the M0 macrophage group, “M2b” indicates the M2b macrophage group.

