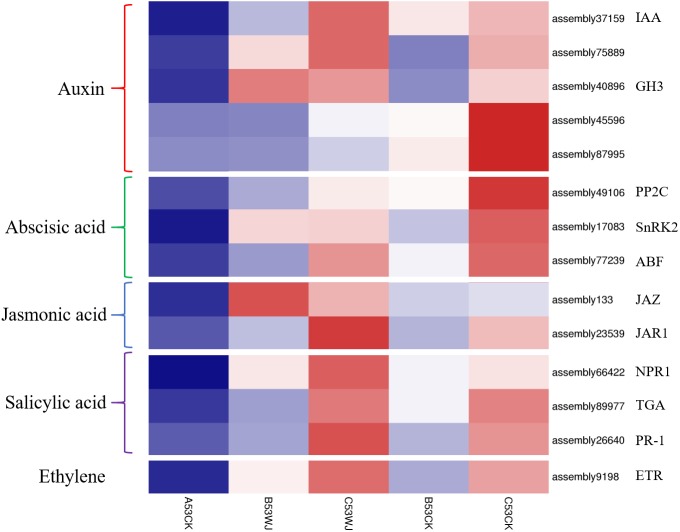
Figure 7. Heat map representation of the expression patterns of DEGs related to the phytohormone biosynthesis and signaling pathways during light-responsive reactions.
A53CK, B53WJ, C53WJ, B53CK and C53CK indicate samples treated by head-shading for 0 d, 7 d and 11 d, and normal light for 7 d and 11 d, respectively. The color scale reflected the log-transformed FPKM values.

